
Report Tags
Overview
Report Tags give you a way to organize and find Insights reports more quickly by applying meaningful labels to them. Once tags are configured and applied, a tags panel appears alongside the report list in each Insights area, allowing any user to filter down to just the reports that are relevant to them. Rather than scrolling through long lists of reports, users can select one or more tags to instantly narrow the view to only the reports that match. This is especially useful in organizations with many configured reports across Funnels, Dashboards, Agent views, Queue views, and Breakdowns.
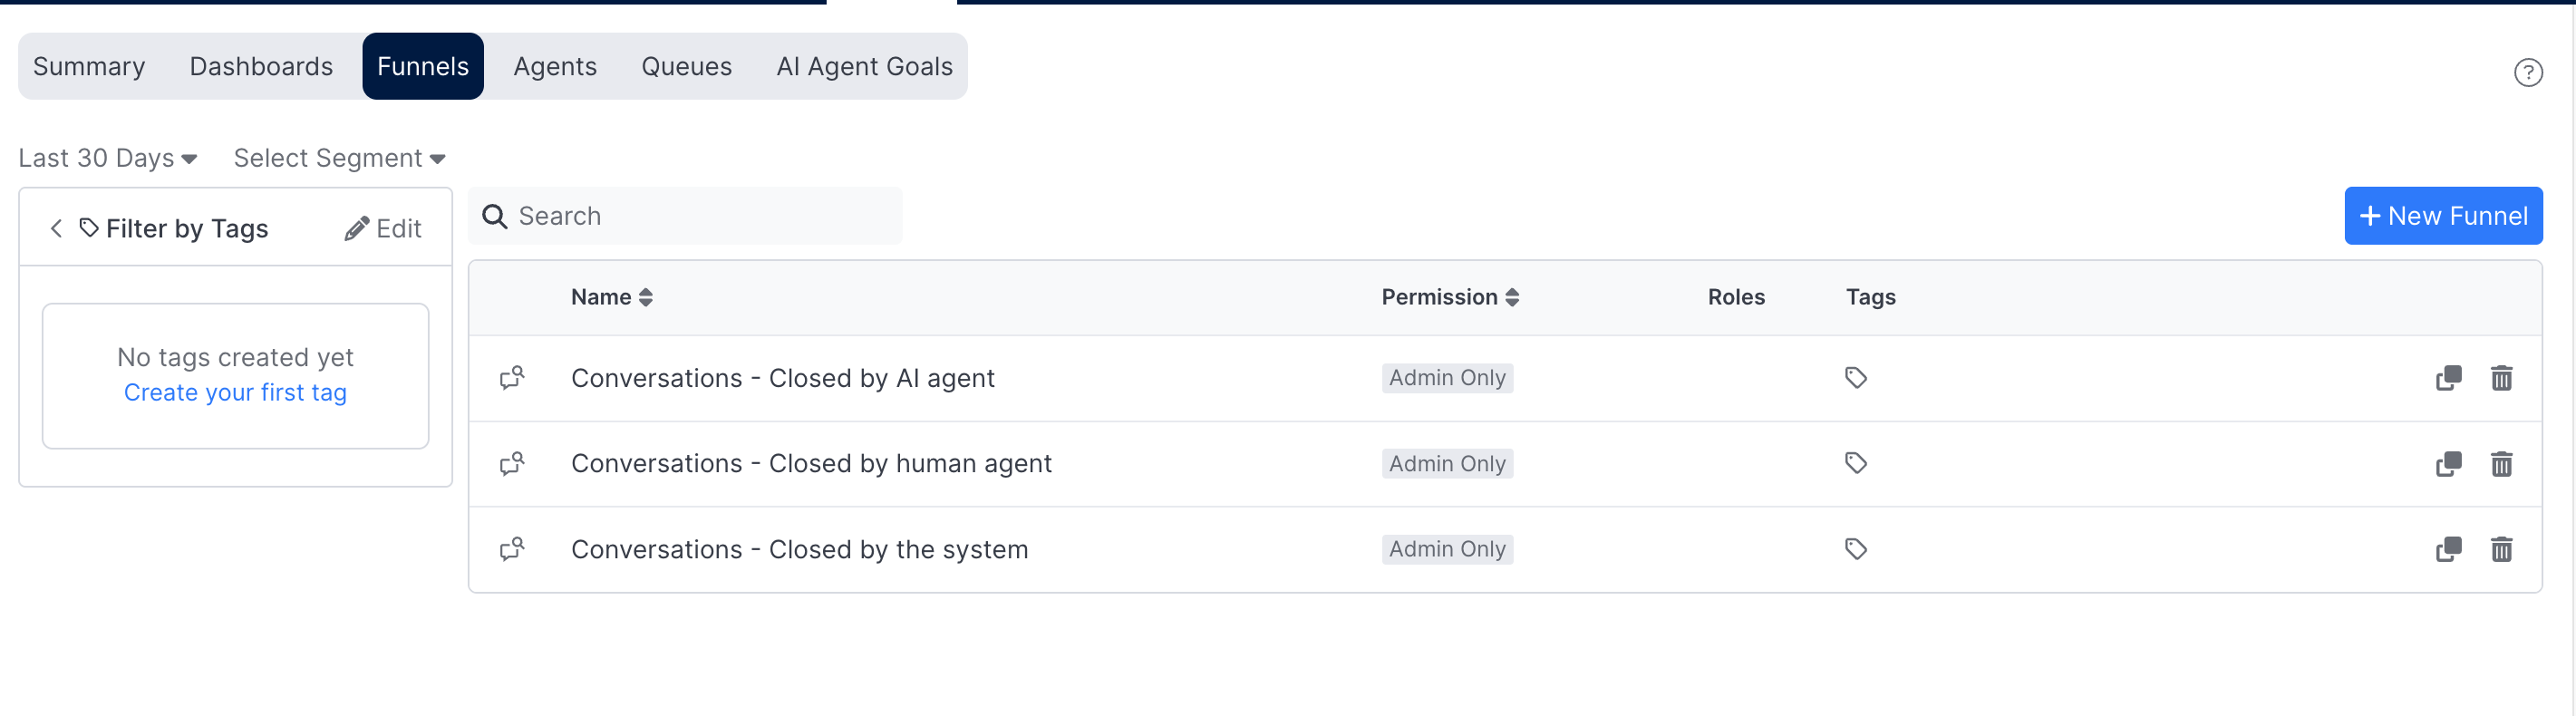
The tags panel is available on the following Insights subtabs:
The same set of tags is shared across all of these areas — tags configured in one subtab are available everywhere, and Search filters applied in one subtab carry over to the others.
Configuring Tags
By default, no tags are configured. When you first navigate to a subtab with the tags panel, a message reads No tags created yet with a link to create your first tag.
Only admin users can configure tags. All users can filter report lists with tags once they are configured.
Entering Edit Mode
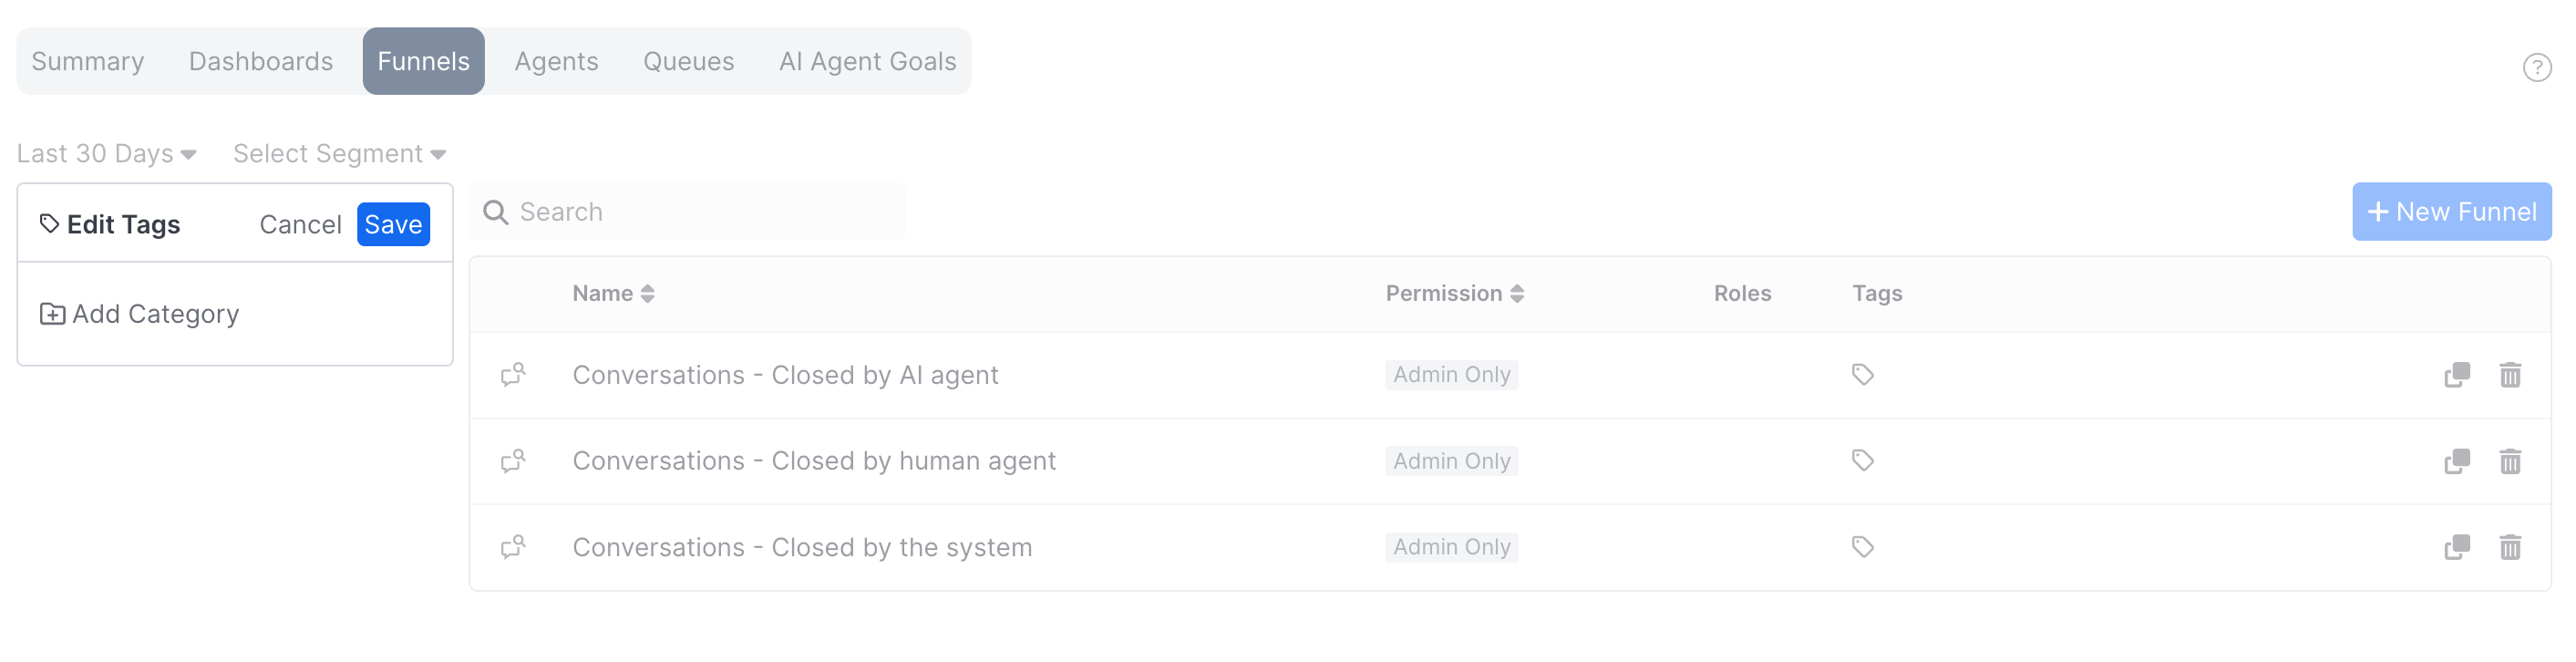
Clicking Create your first tag or the Edit button puts the tag panel into edit mode. While in edit mode, the rest of the Reports tab is grayed out and unavailable — you cannot open or create reports, or switch between Insights subtabs or Reports tabs, until you either save your changes or cancel out of edit mode.
Tag Categories
Tags are organized into categories, which group related tags together under a shared label and color. For example, you might create a category called "Brand" and add a tag for each brand your organization supports. At least one category must exist before any tags can be created.
Click Add Category to create the first category. The name field defaults to Tags and is immediately focused so you can type a new name. Categories are listed in alphabetical order and reorder automatically when a tag is added or a name is changed.
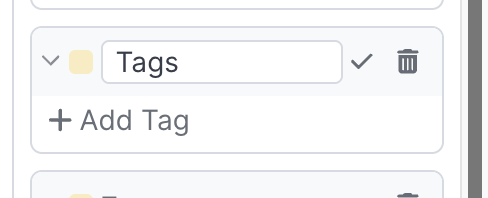
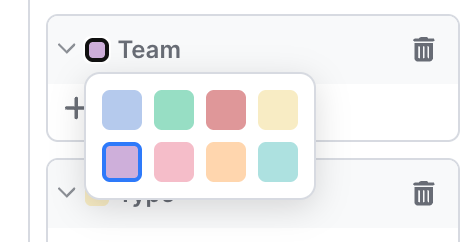
Each category is assigned a distinct color, and all tag chips belonging to that category share the same color throughout the interface. Colors are assigned automatically in sequence as categories are added, but any category's color can be changed at any time by clicking the color indicator to the left of the category name. A popover presents eight color options to choose from. The same color can be applied to multiple categories if desired.
To delete a category, click the trash can button next to it. Keep in mind that deleting a category also permanently removes all tags within it, and any reports that were associated with those tags will no longer be filterable by them.
Tags
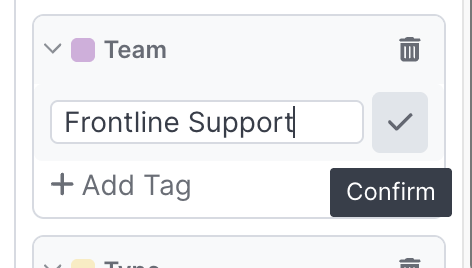
Once at least one category exists, tags can be added within it by clicking the +Add Tag button under the category. The name input is focused immediately so you can begin typing. Confirm the tag by clicking the checkmark button. Tags within a category are displayed in alphabetical order and reorder automatically when added or renamed.
To remove a tag, click its trash can button.
When you are done making changes, clicking Save exits edit mode and applies the changes throughout the interface.
Category and tag names can be renamed after they have been saved. Renaming a category updates its label everywhere it appears — in the tags panel, the tag selector, and the report list. Renaming a tag updates the chip label displayed in report lists and in all tag selectors.
Applying Tags to Reports
Once tags are configured, they can be associated with any report either from the report list page or from within an individual report.
From the Report List
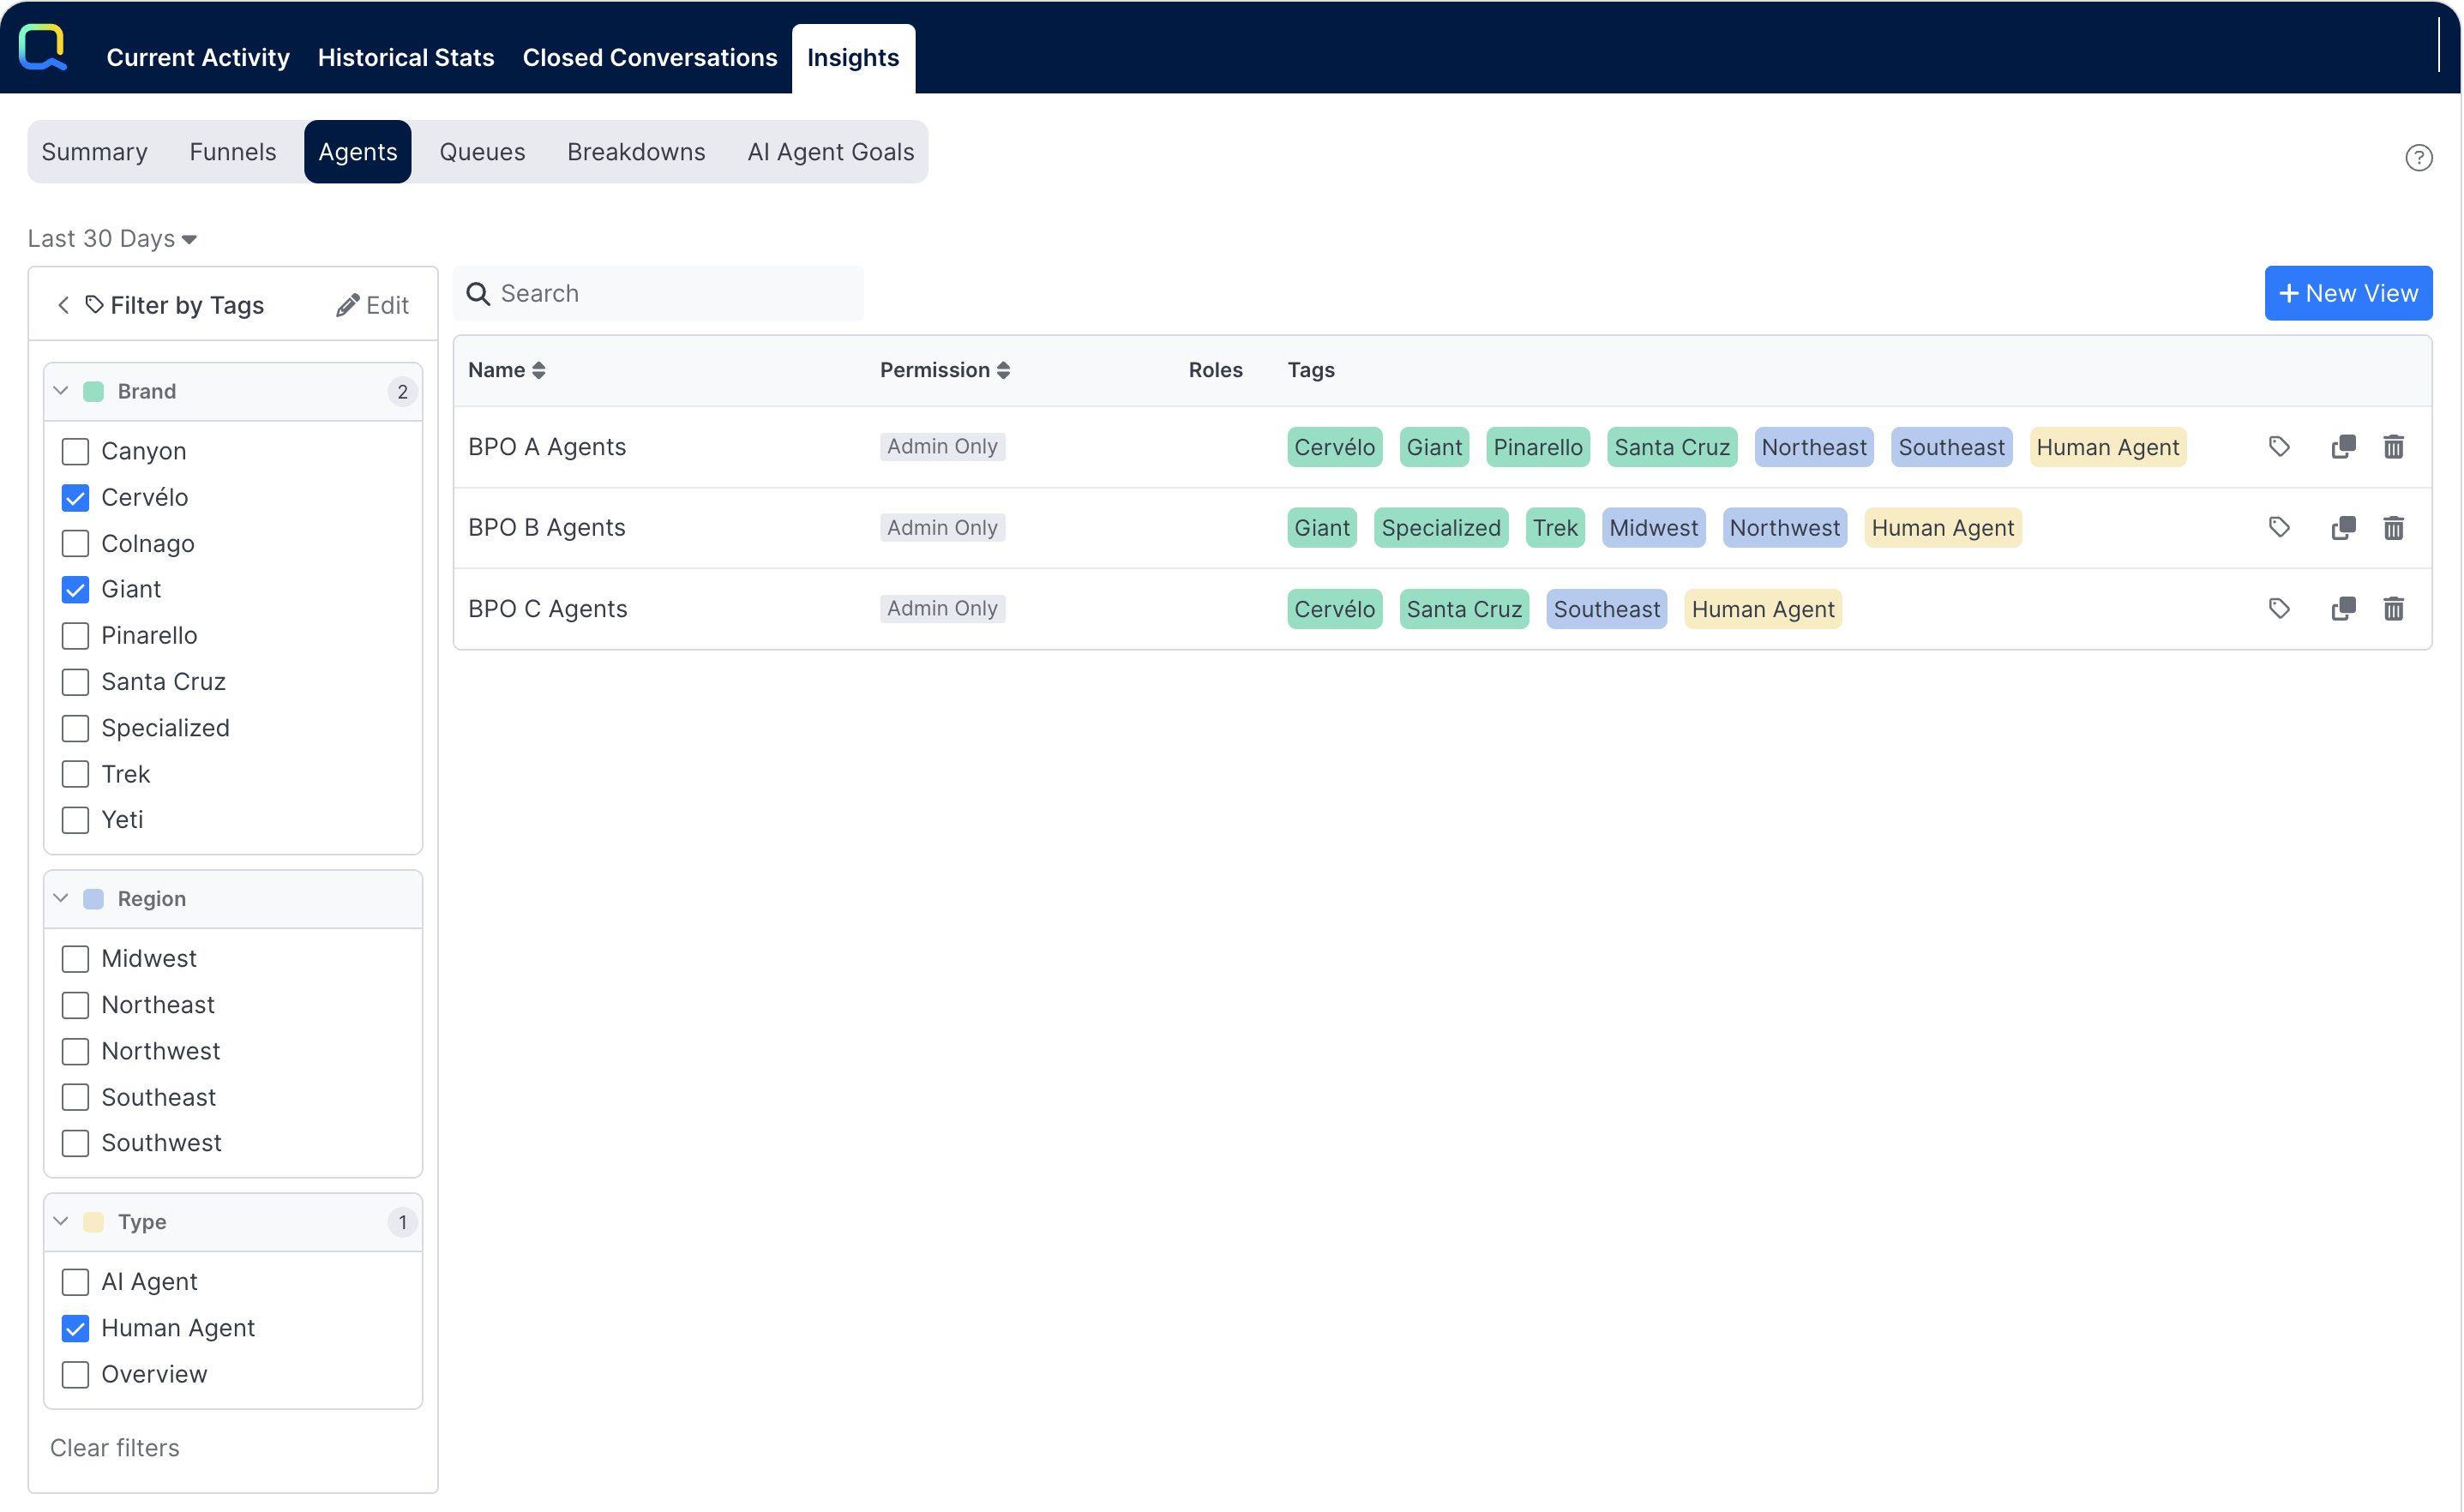
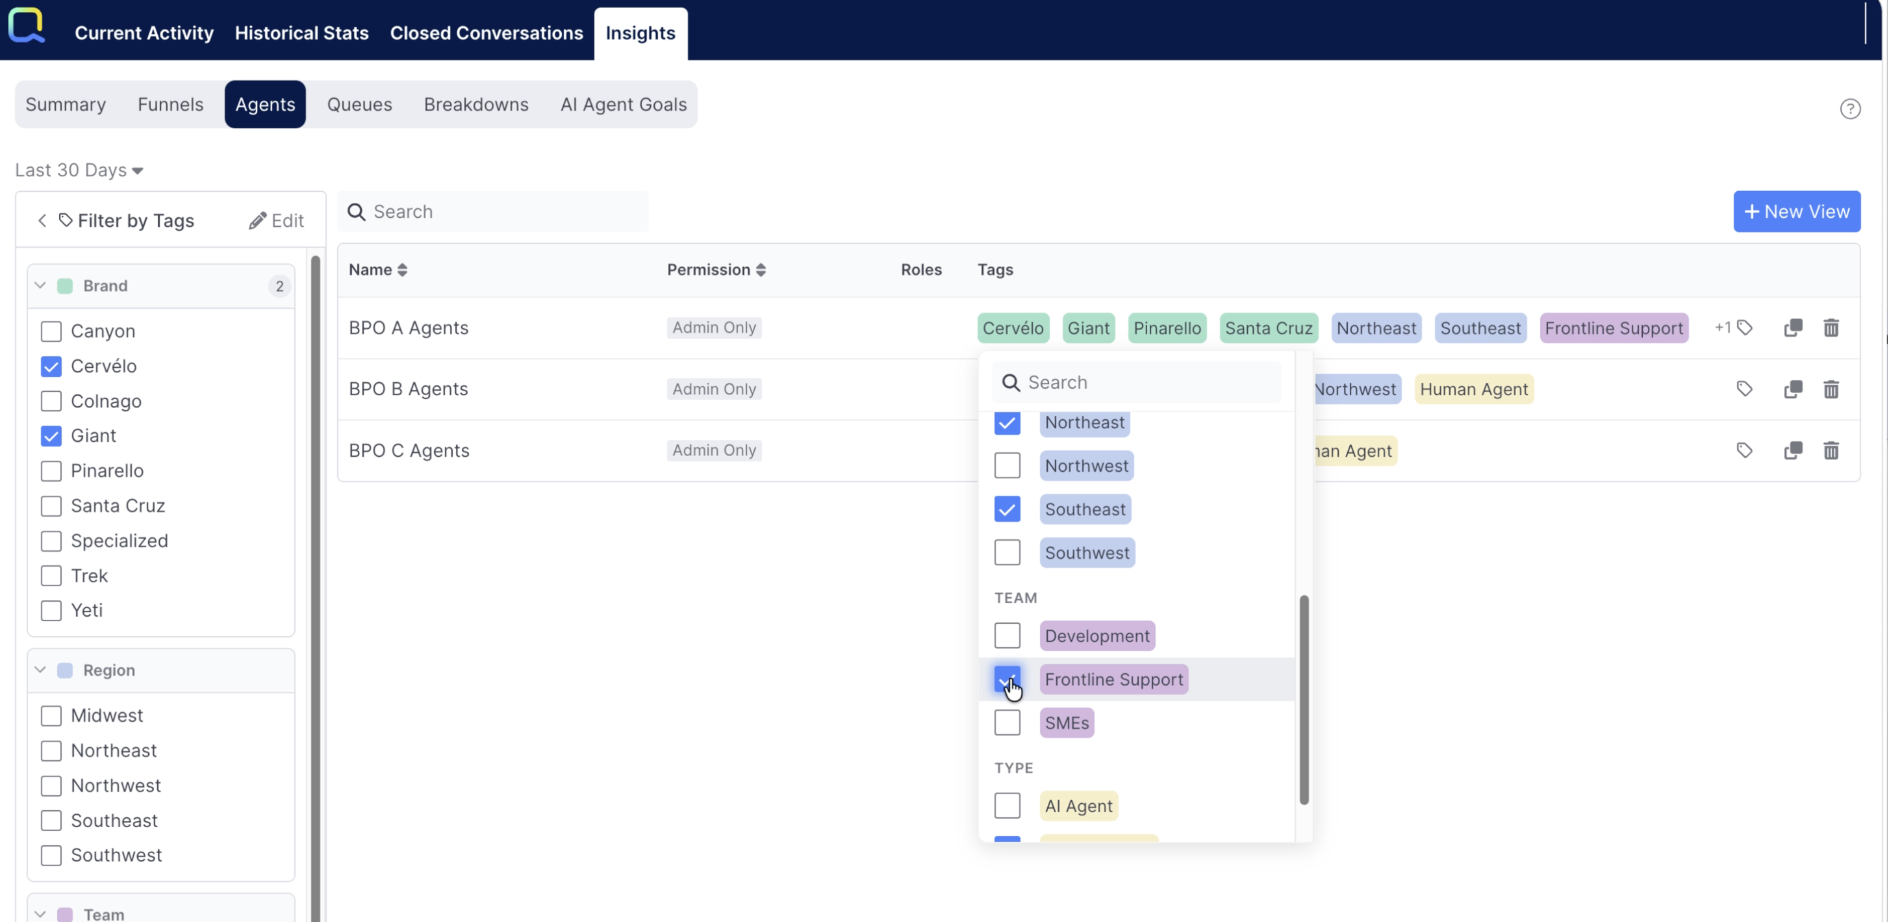
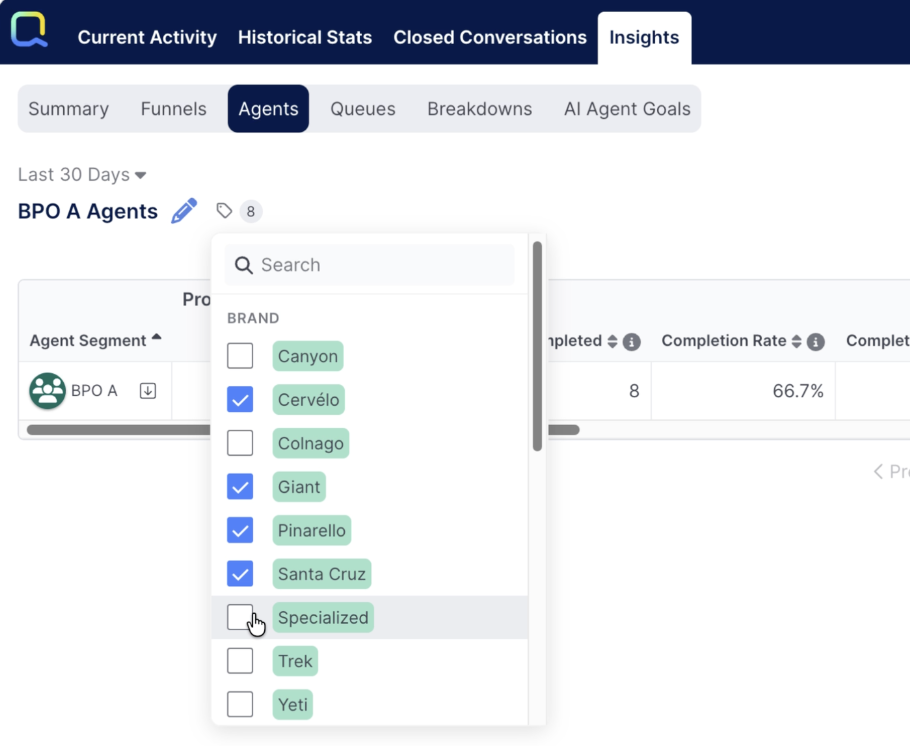
Each report in the list includes a Tags column showing any tags already associated with it, displayed as colored chips matching their category color. If there are more tags than can fit in the column, a +X indicator shows how many additional tags are associated but not currently visible.
Clicking the Manage tags button on any report opens a selector showing all configured tags grouped by category, in the same order they appear in the tags panel. Each tag has a checkbox — checked tags are currently associated with the report, unchecked tags are not. You can check and uncheck freely, and use the search box at the top to quickly find a specific tag when working with a long list. Once you have made your selections, clicking anywhere outside the selector closes it and immediately updates the Tags column to reflect the changes.
From Within a Report
Tags can also be managed when a report is open for viewing or editing. The Manage tags button appears at the top of the report screen, near the report name. Clicking it opens the same tag selector described above. As tags are selected or deselected, the count shown on the Manage tags button updates to reflect the current number of associated tags. The button shows only the count — to see which specific tags are associated, open the selector.
Both admin and manager users can open the selector to view which tags are associated with a report. Only admins can make changes. When the report is saved, the tag associations are saved along with it and will be reflected in the report list.
Filtering Reports with the Tags Panel
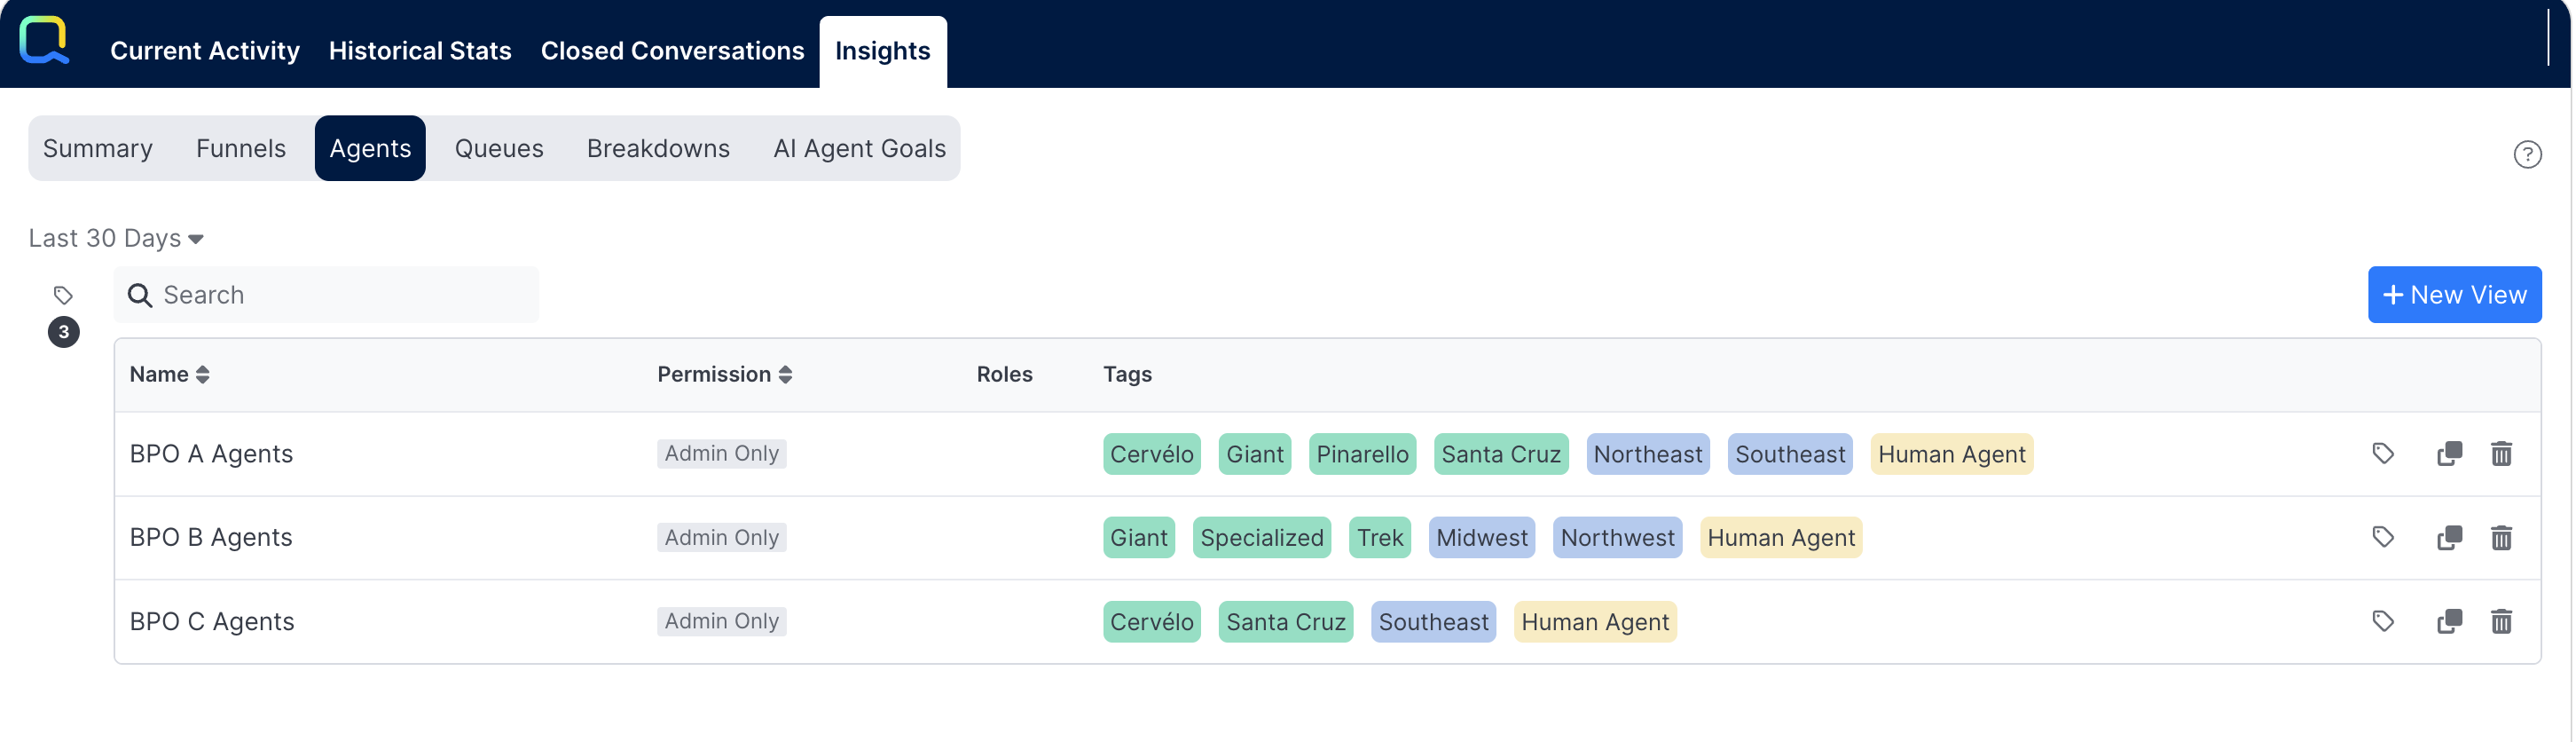
The tags panel appears as a collapsible left panel whenever a report list is displayed. If you are not using tags to filter, the panel can be collapsed by clicking the< button next to the Filter by Tags heading. When collapsed, the panel can be re-expanded using the tag icon in the upper left. Collapsing or expanding the panel on one subtab applies the same state to all other Insights subtabs. The expanded or collapsed state persists across page refreshes and reloads.
When the panel is expanded, clicking any tag immediately refreshes the report list to show only matching reports. The filtering logic works as follows:
- If tags from only one category are selected, any report associated with at least one of those tags is shown
- If tags from multiple categories are selected, a report must match at least one selected tag from each category in order to appear
This allows you to narrow results precisely — for example, selecting two brands from a Brand category and two teams from a Team category would return reports associated with at least one of those brands and at least one of those teams.
Each category in the panel shows a count of how many of its tags are currently selected, which is helpful when a category is minimized to save space. A Clear filters button appears at the bottom of the panel whenever at least one tag is selected; clicking it removes all active filters and returns the full unfiltered list.
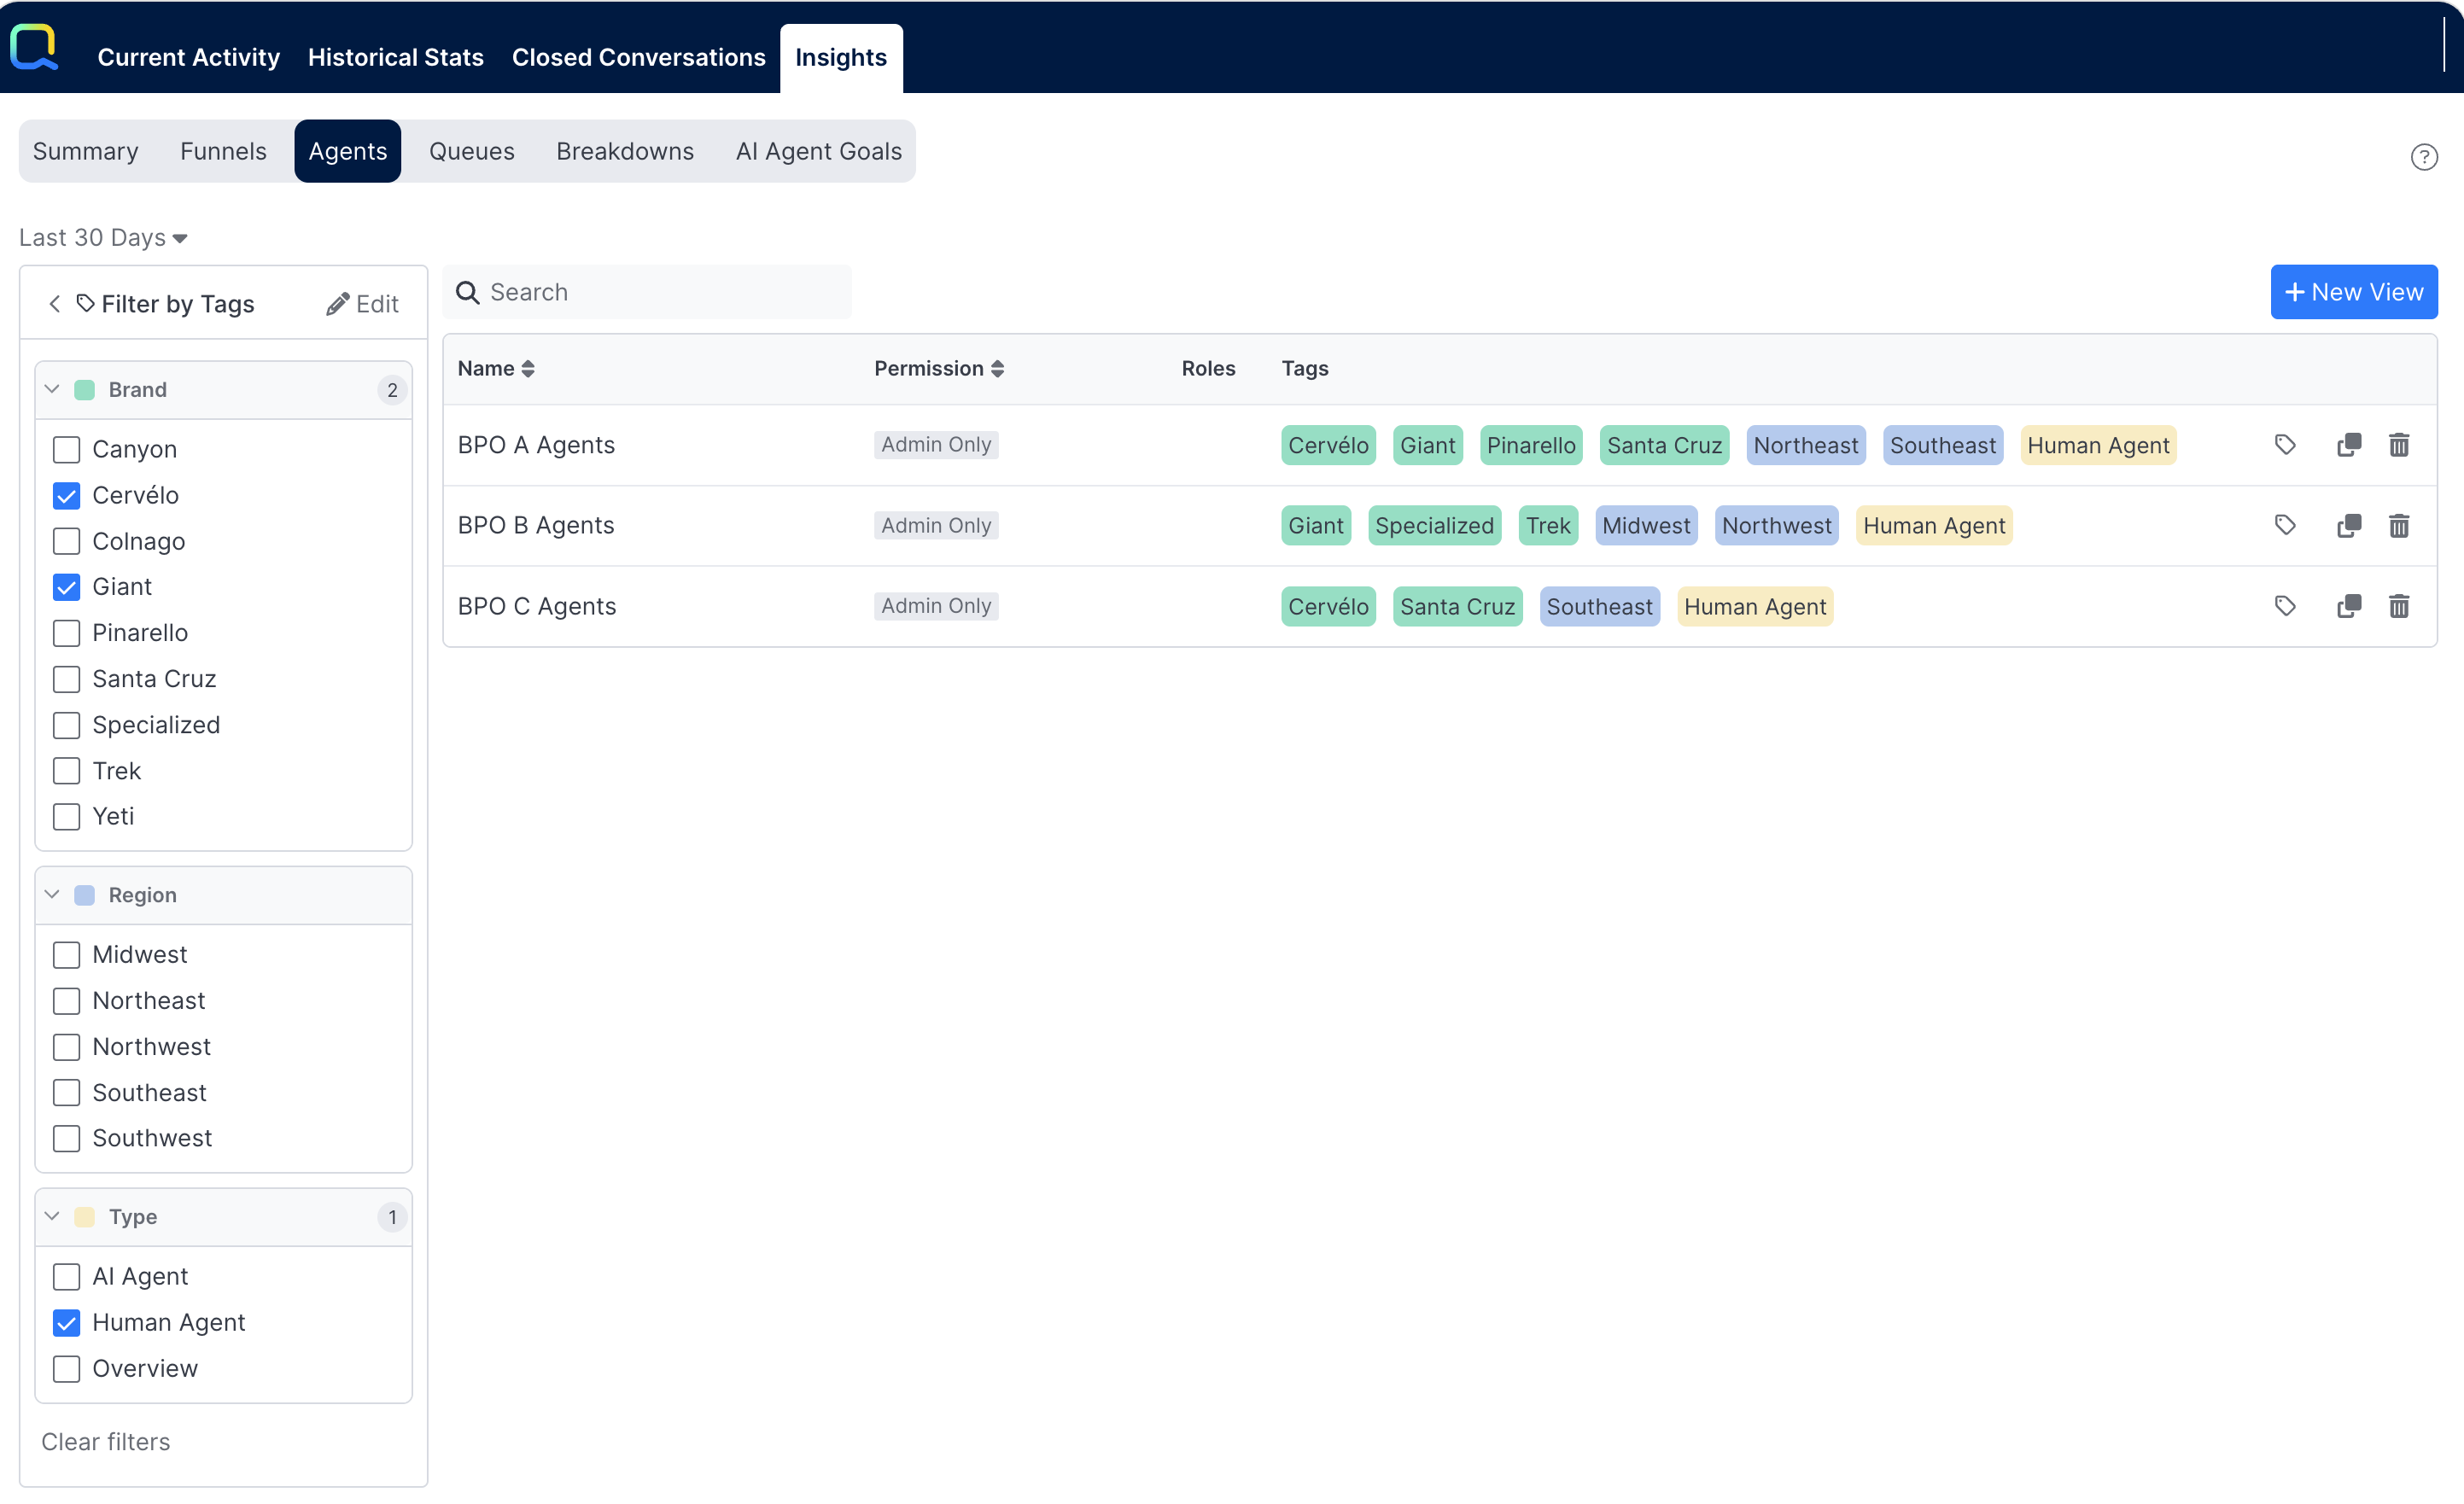
When the panel is collapsed with active filters, the tag icon displays the total number of selected tags so you can see at a glance that filtering is in effect.
Tag filter selections are personal — each user can choose the tags most relevant to them, and those selections persist across refreshes and sessions. Selecting or deselecting a tag in any subtab applies the same change across all other subtabs simultaneously.
Updated 3 months ago