
Queue Insights
Overview
Queue Insights provides a way to create highly customized views into the workload, capacity and activity for each queue. Metrics can be aggregated by individual queues, or groups of queues, for a specified period of time.
Queue Insights can be run for date ranges after May 1, 2023.
Views
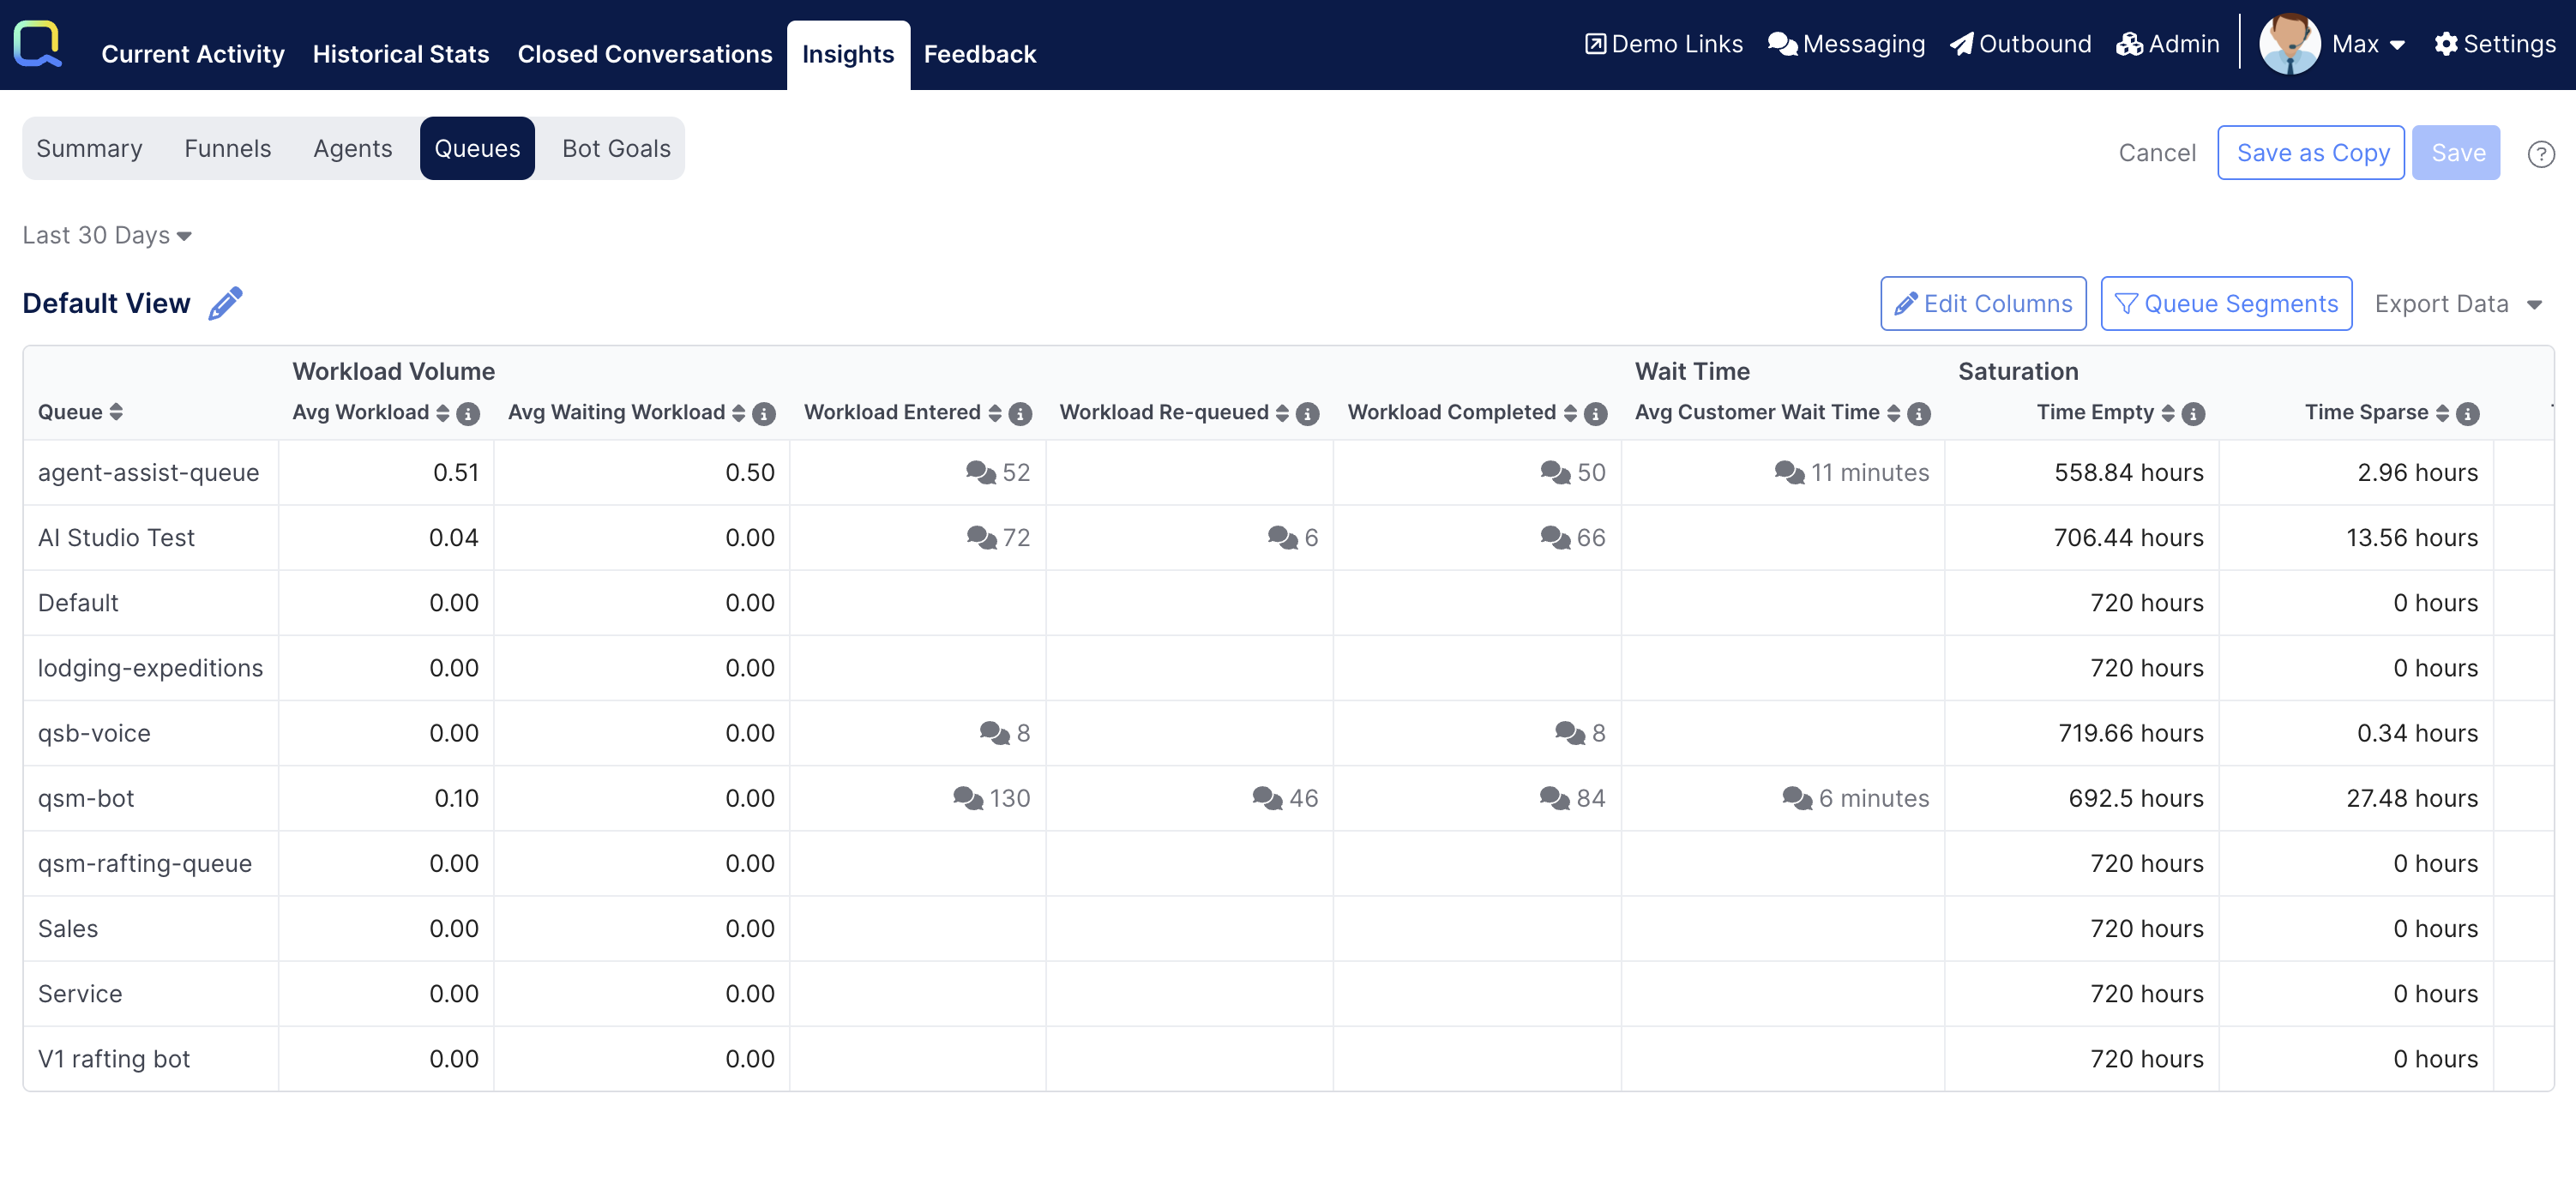
A View is a version of the Queue Insights report that can be modified and saved to show a specific configuration. The first thing users will see when clicking into Queue Insights will be all the existing Views they have access to in their Quiq site:
Views enable Admins to:
- Only include certain queues
- Select which metrics to display, and hide any metrics that are not applicable to the audience
- Customize how the data is formatted, like the time units for duration columns, the decimal precision for number columns, or rather to show a percentage as a progress bar.
- Allow a View to be available to specific Manager users by Role
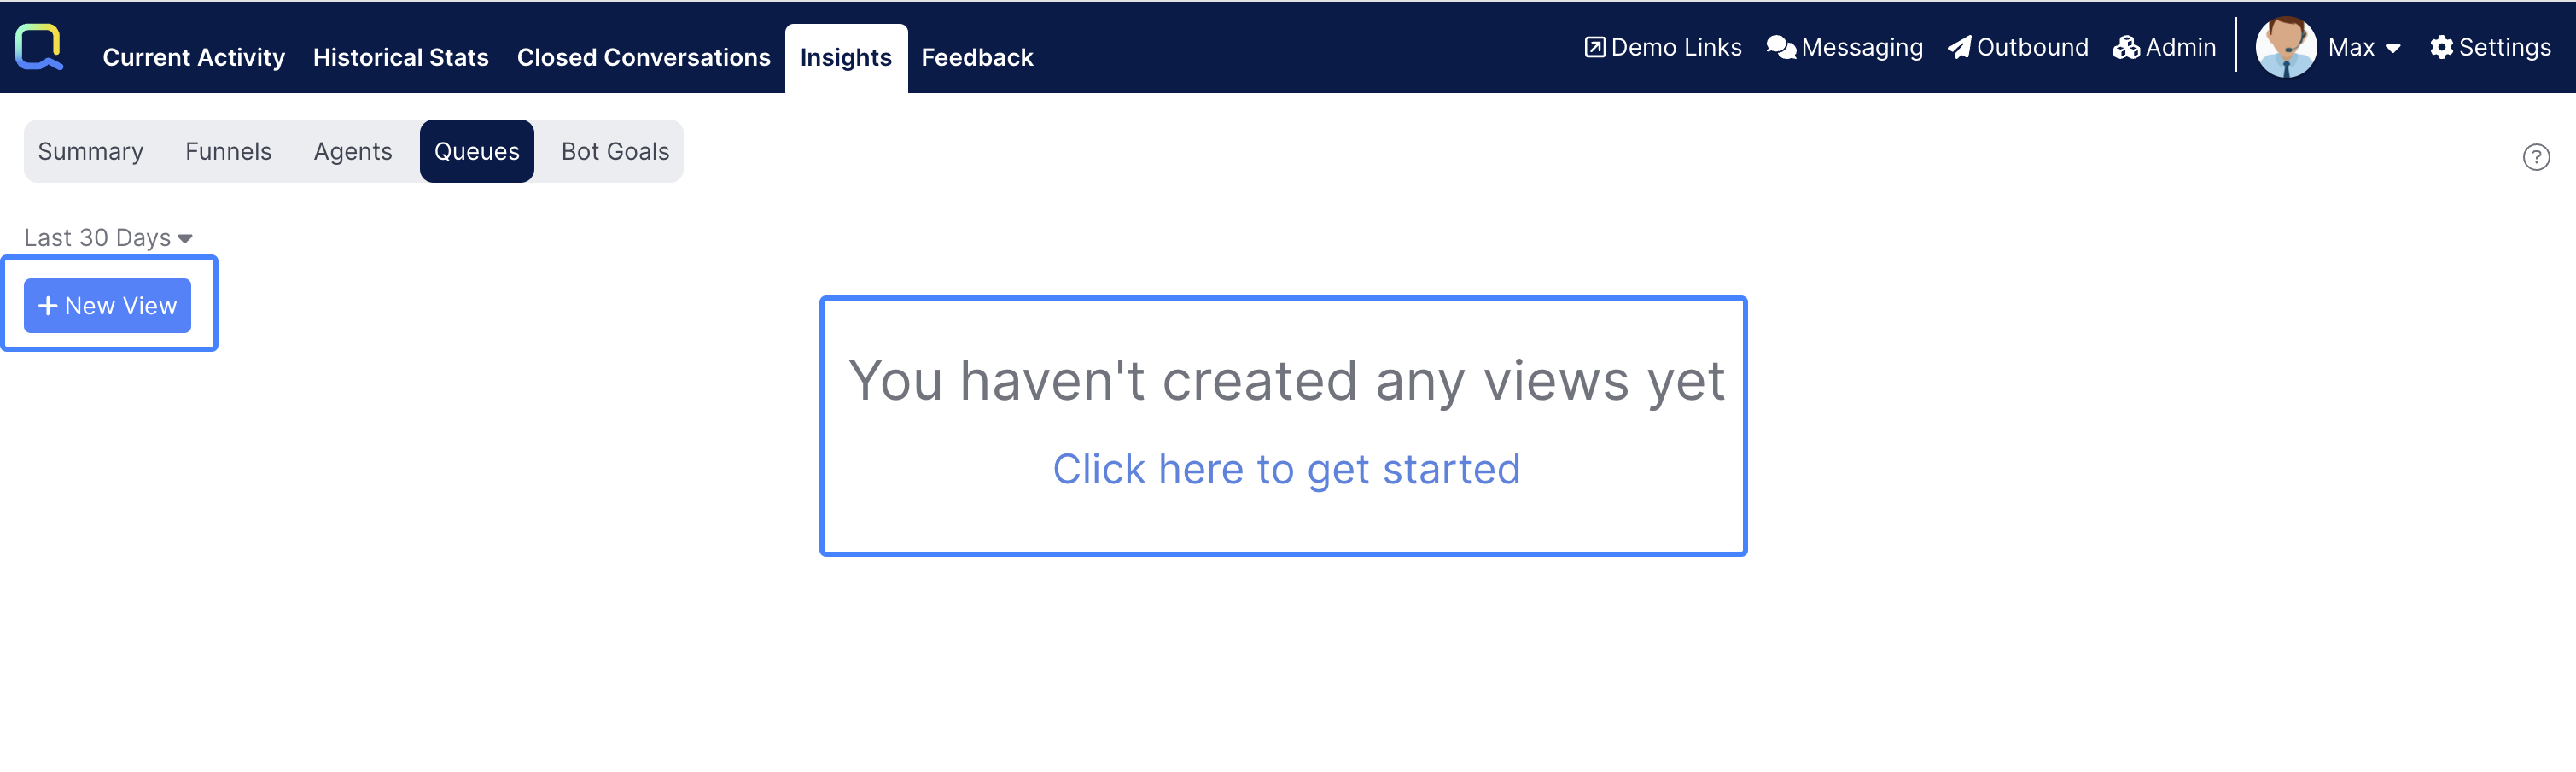
By default there will be no Views created in Queue Insights, Admins can use the New View button, or the call to action in the middle of the screen to get started:
Opening a View
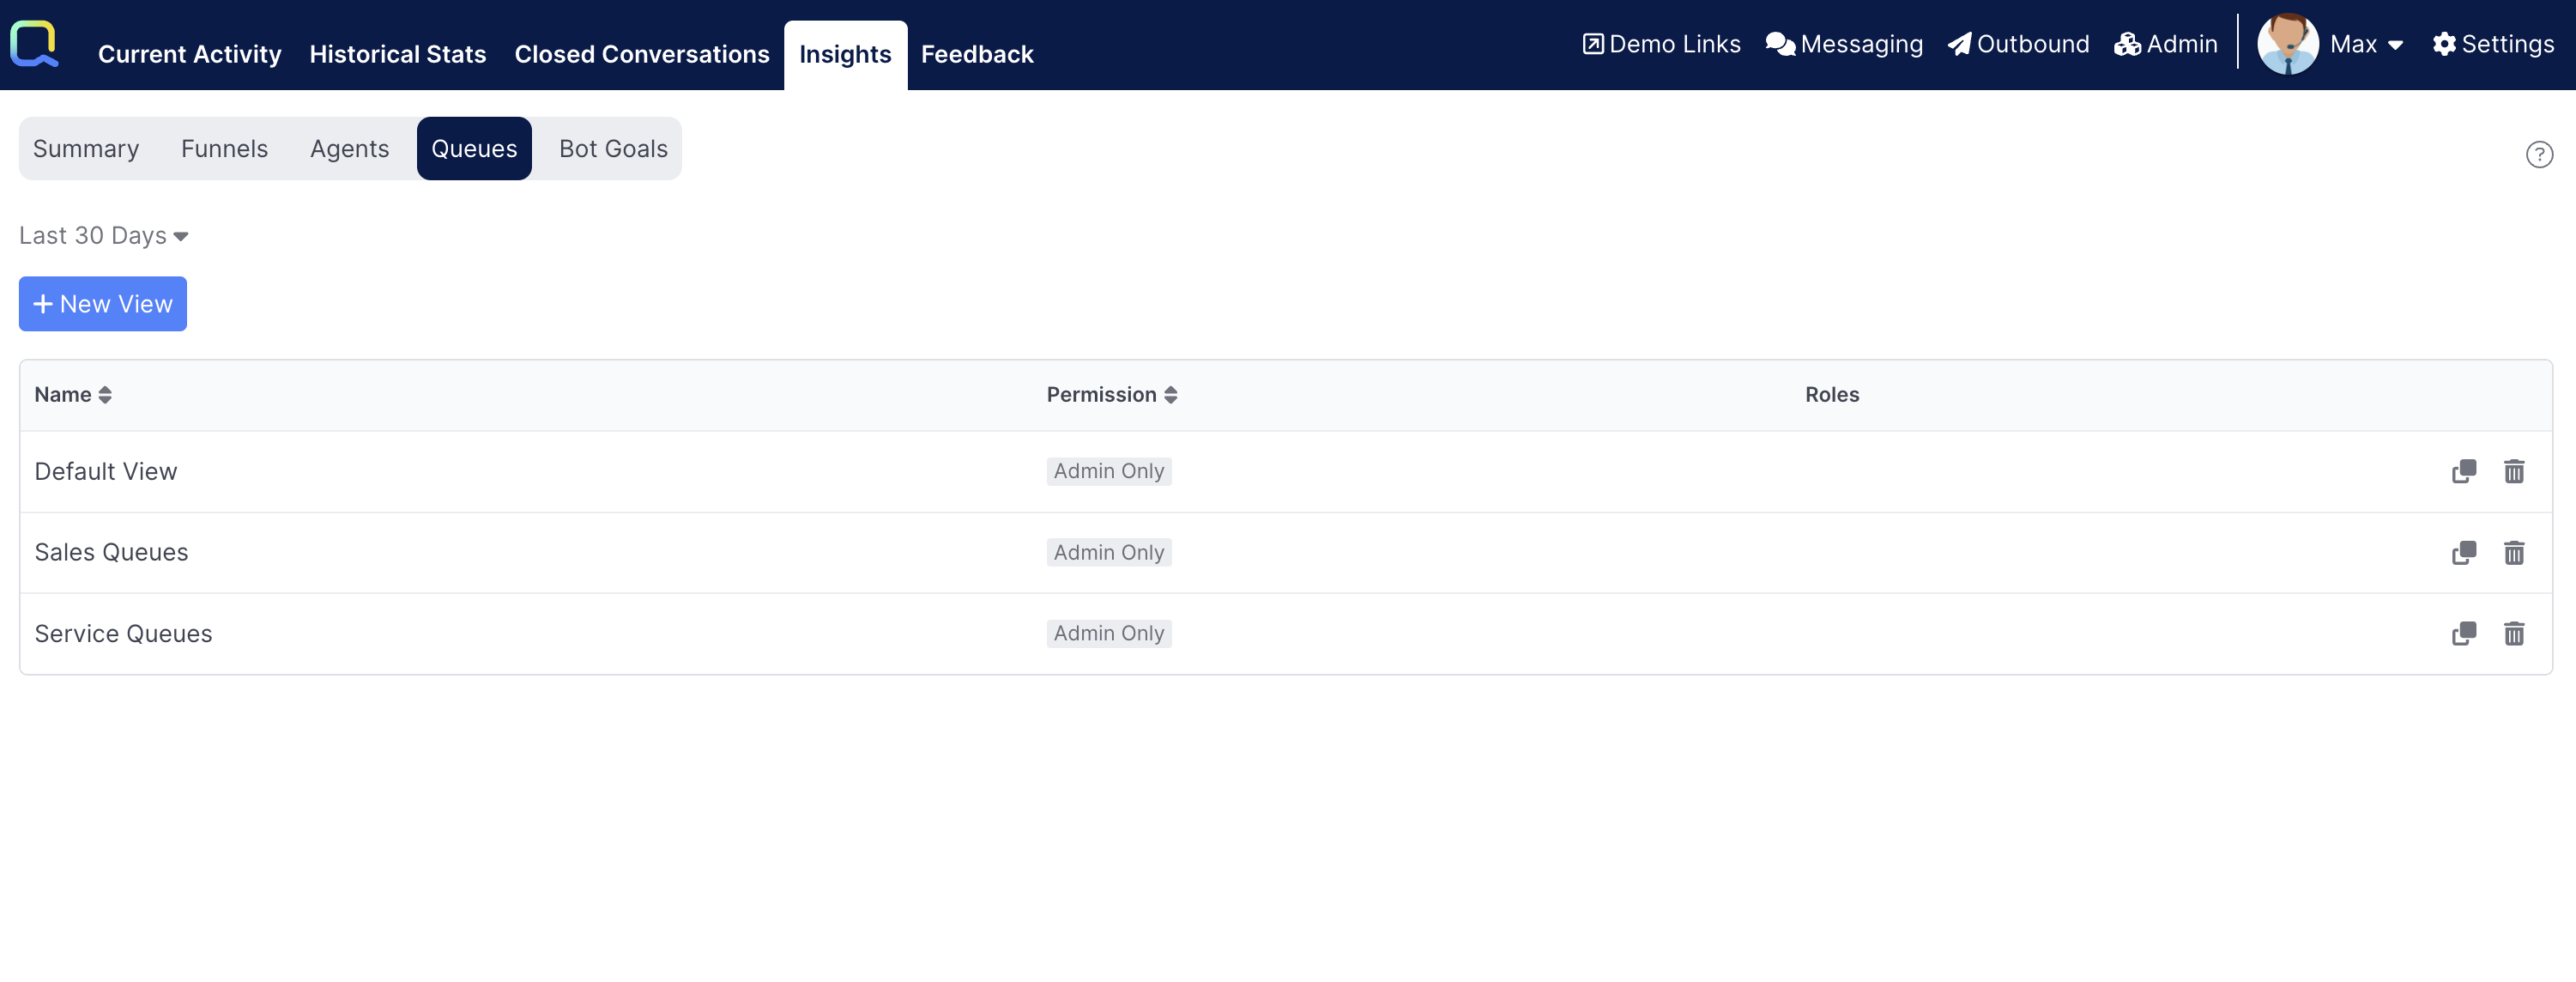
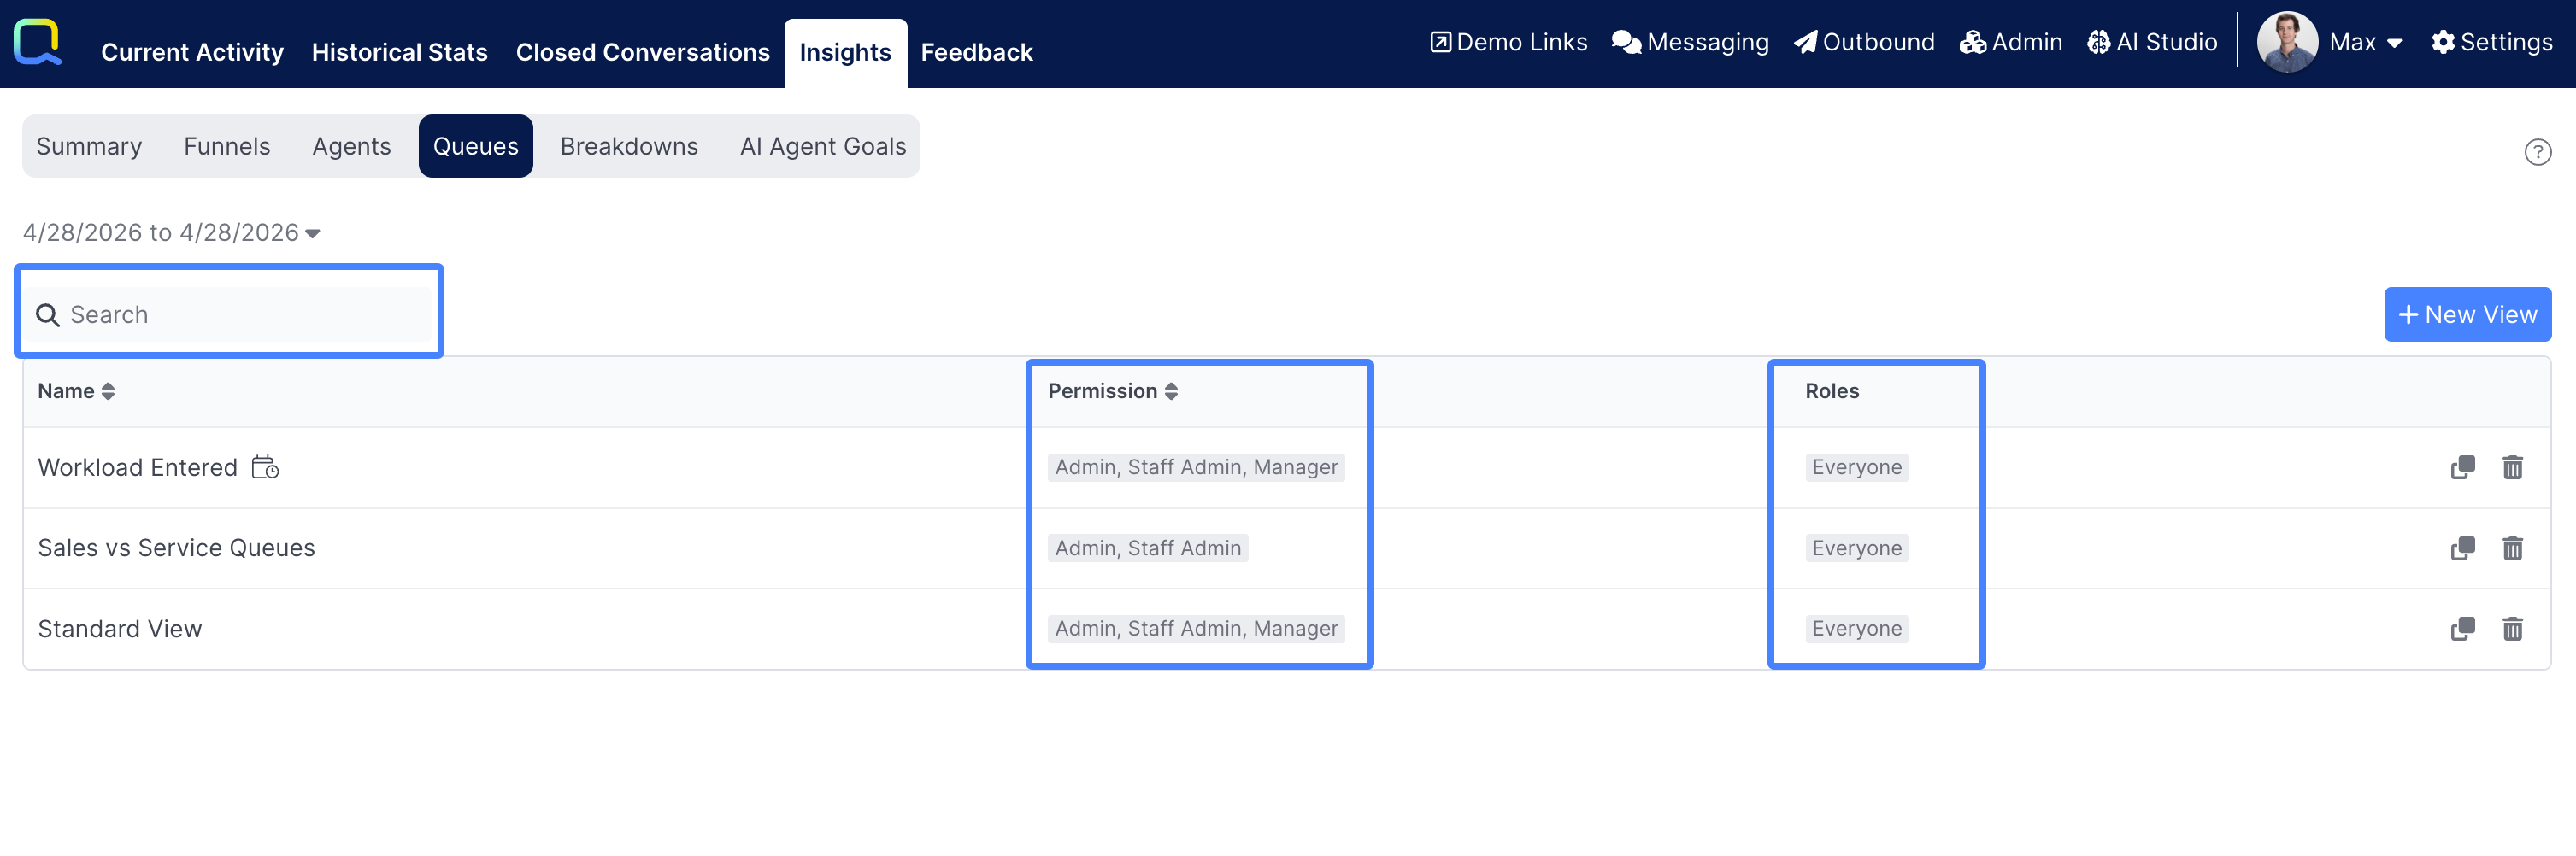
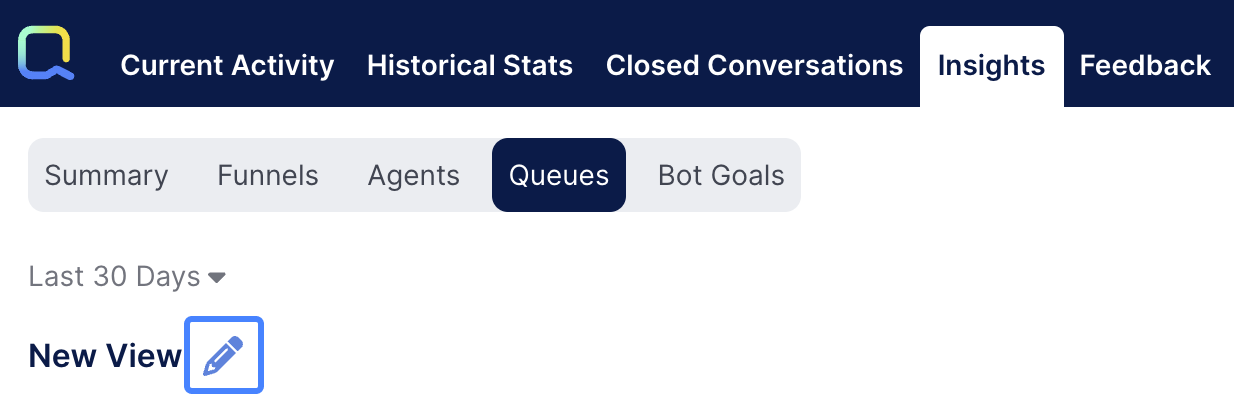
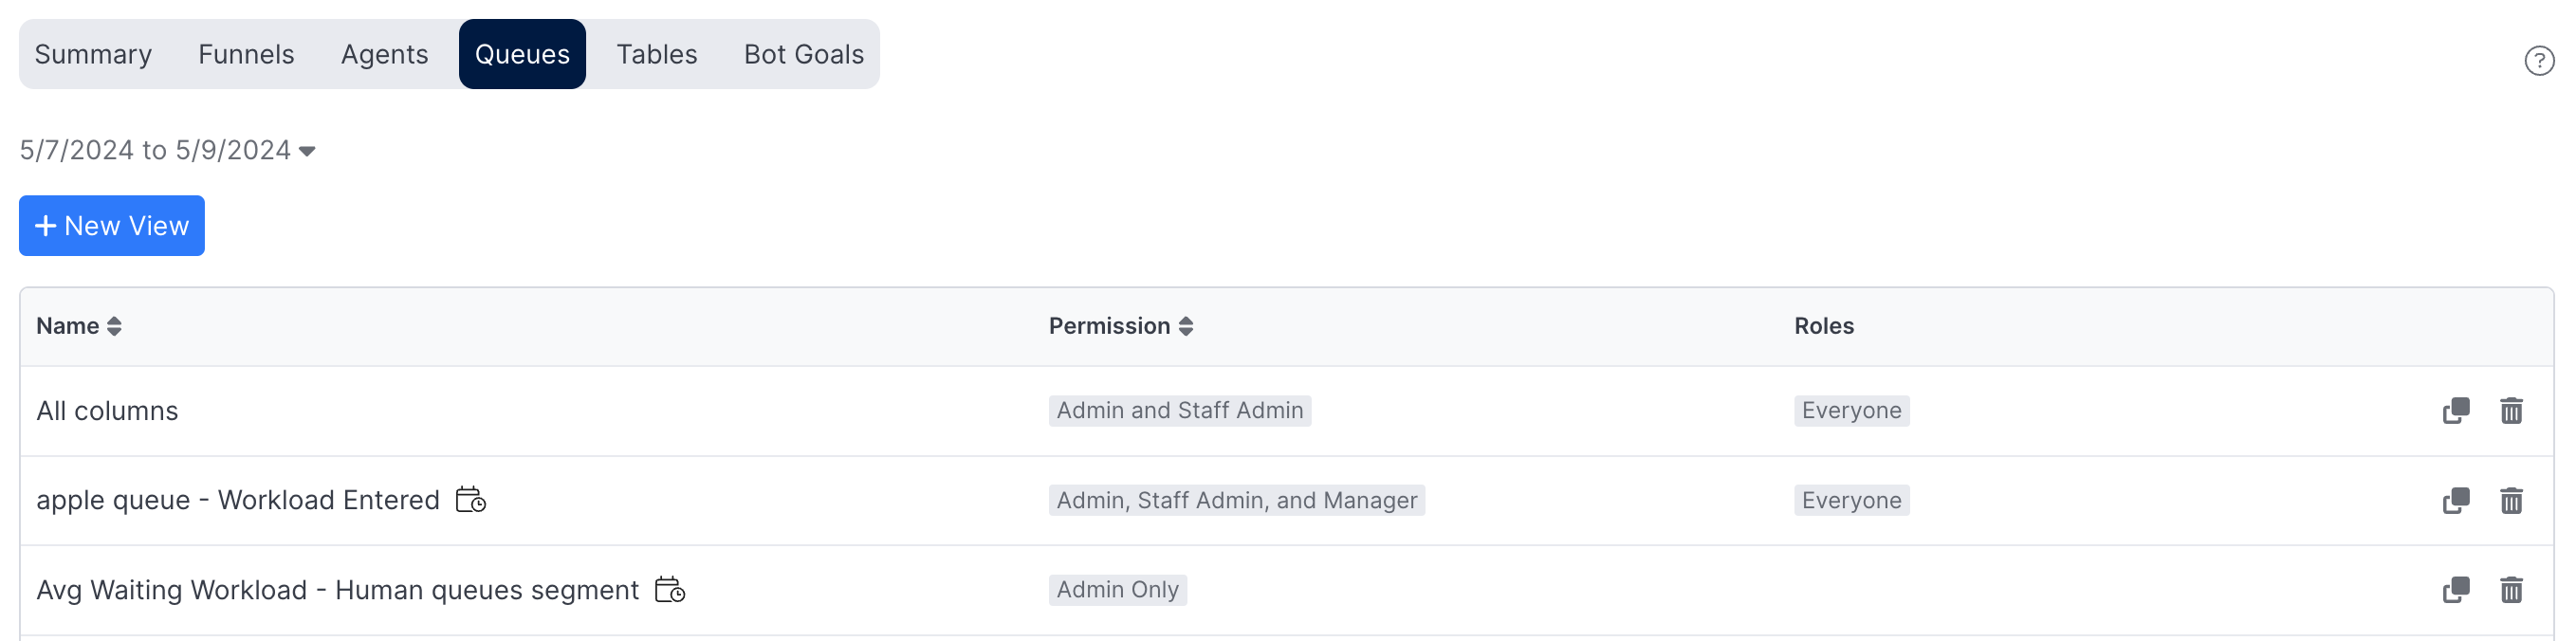
Navigating to the Queues tab within the Insights tab in Reports will show a list of all the Views the logged in user can access. Users can use the available Search bar to search for a specific report.
Admins will see all the Views that have been created. Staff Admins and Managers will only see Views they have been granted access to by Role:
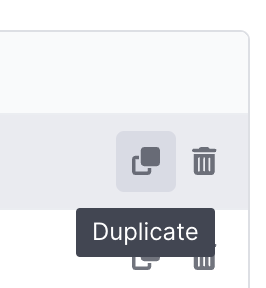
Administrators can Copy or Delete a View from the list by choosing the buttons on the right:
Only Administrators can create and edit Views.
Staff Admins and Managers will not see the Queues tab until they have been granted access to at least one View.
General Settings
Select the pencil icon next to the View name to access general settings:
Within General Settings an Admin can manage the following:
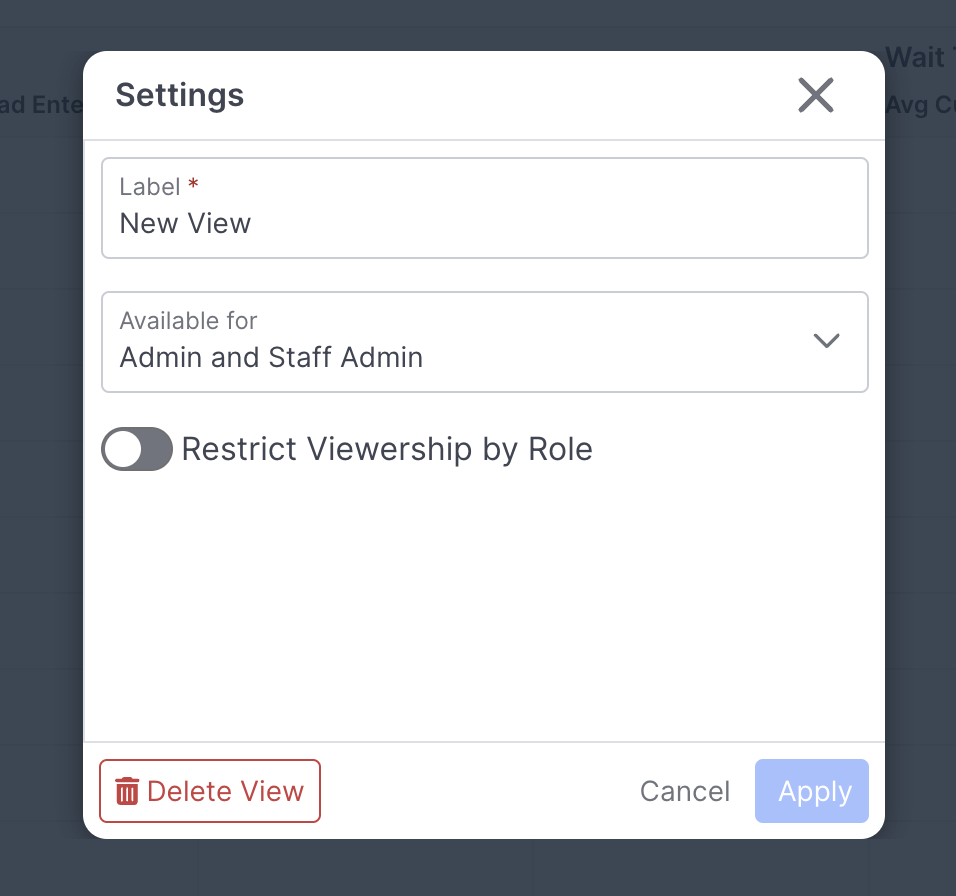
1. Label: Change the label name of the View
2. Available for: Grant viewer permission to sets of Users.
- Admin users will always see all Views.
- Staff Admin users and Managers will only see the View if it is marked as Available for Admin and Staff Admin or Admin, Staff Admin, and Manager.
- If the Restrict Viewership by Role toggle is disabled, all users for the selected permission set will see the View. If the toggle is enabled, then a non-Admin user must be a member of one of the selected routing roles in order to have access to the View.
3. Delete View: Delete the View. Once a View has been deleted, it is no longer accessible to any user.
Edit Columns
Select the Edit Columns button to customize which metrics are displayed as columns in the table, and how they are displayed.
The left side of the dialog will show all of the available metrics by category:
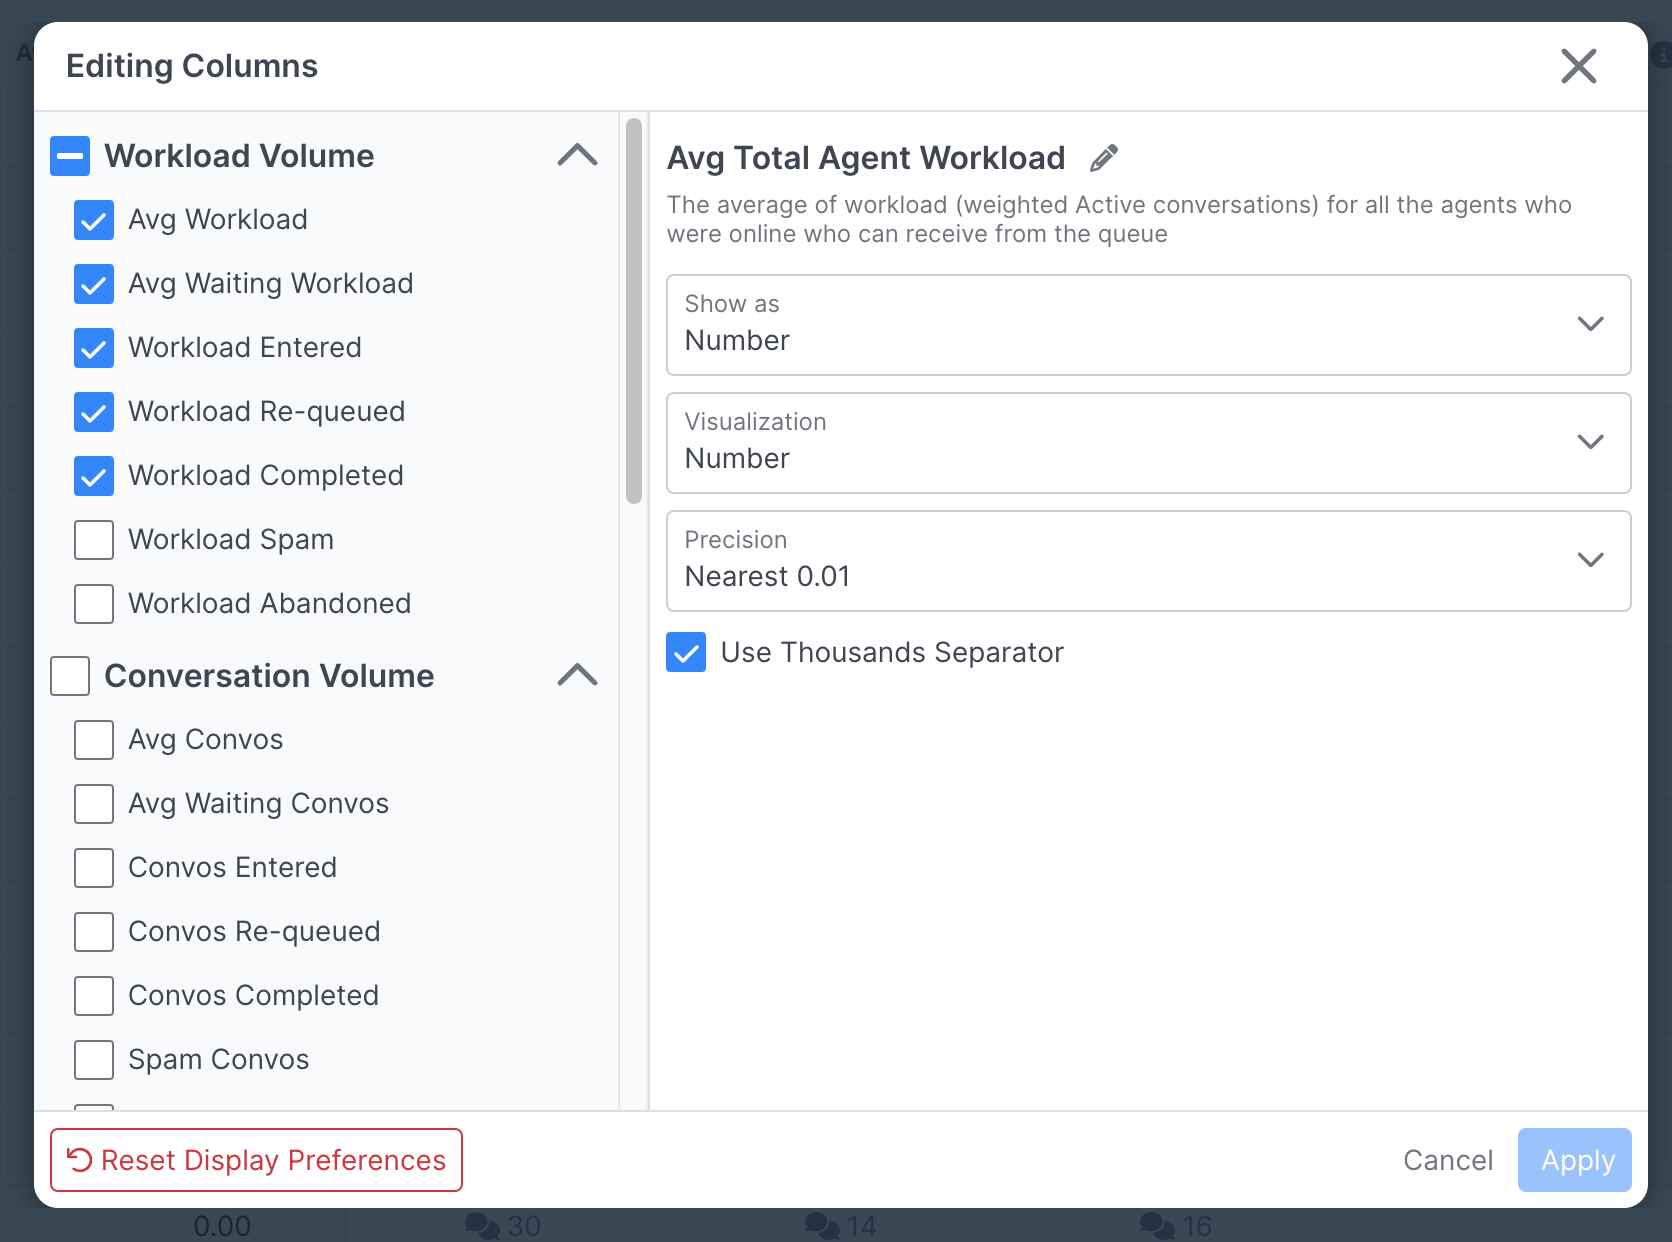
An Admin can check and uncheck available metrics to display or hide them as desired.
All the metrics for a section can be selected (or unselected) by checking the box in the the Category heading.
When a column is selected on the left, the right side shows the display options for that column. The types of display options differ by the type of field. Number and Percent fields allow visualization to be set to a number or a bar, and the decimal precision can be changed. Duration fields can have the displayed time units changed.
Reset Display Preferences will change all column visibility and display options back to that of the default base view.
Each View can have a maximum 50 visible metrics columns.
Queue Segments
Queue Segmentation can be applied to the Queues table much the same way as other Segments work in other Insights sections. This allows the data to be filtered to a subset of queues, and also allows the data to be aggregated by a group of queues rather than each queue individually.
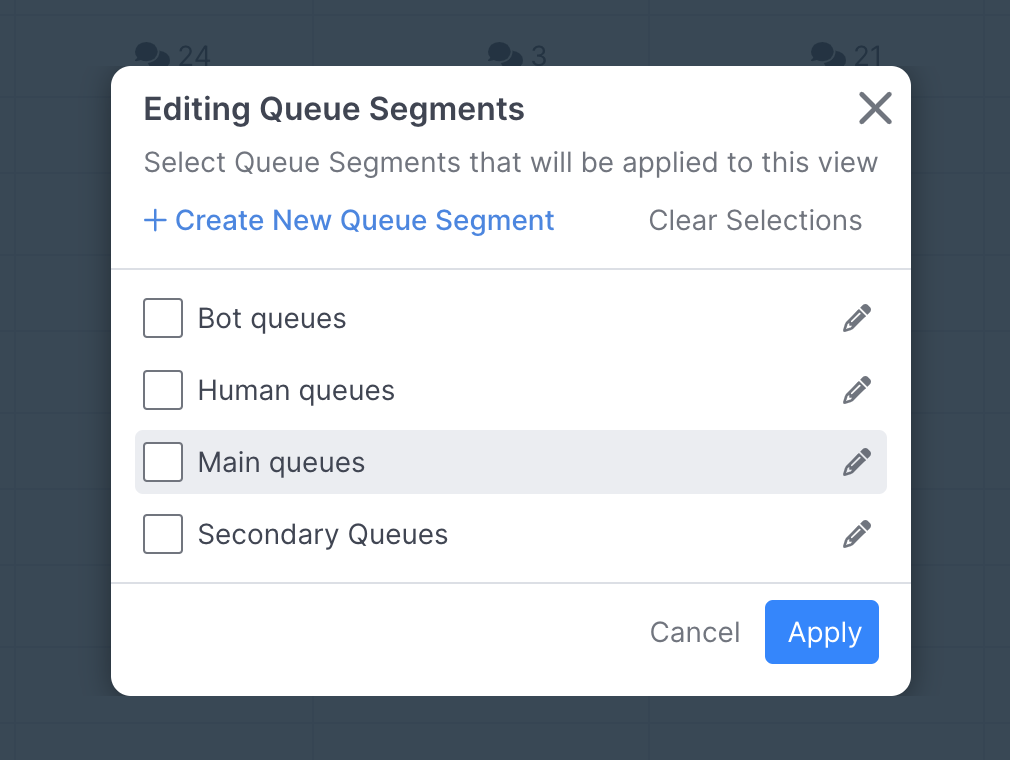
Select the Queue Segments button to apply or configure Queue Segments. A list of available segments is available to apply to the view. Or, a new segment can be created.
Creating a new Queue Segment
Select the Create New Queue Segment button to open the segment editor:
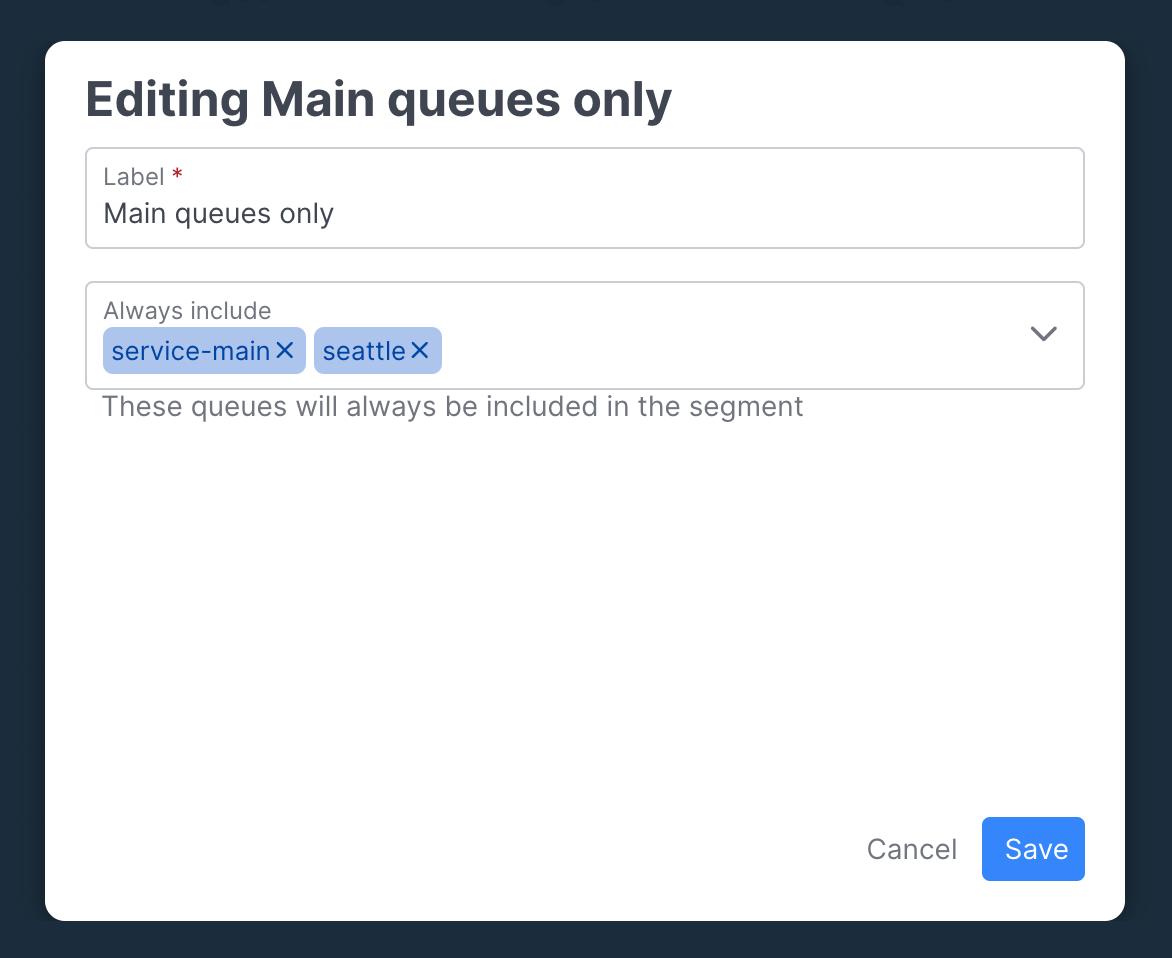
Use the dropdown selector to choose the queues to include in the segment. The segment can then be saved and can be applied to the Queues table.
Applying Queue Segments
A Queue Segment will not be automatically applied to the data after it is saved. To apply a Segment select it from the selection list:
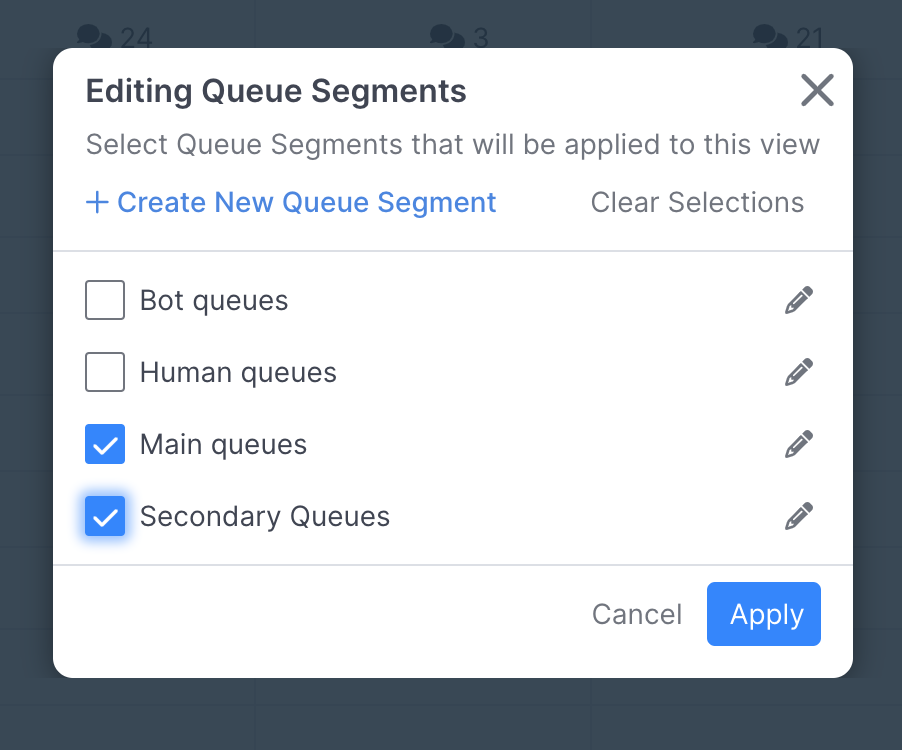
Multiple Queue Segments can be applied at once. This will have the overall effect of returning the queues that match any of the selected segments, and each selected segment will be listed as a separate grouping in the returned results.
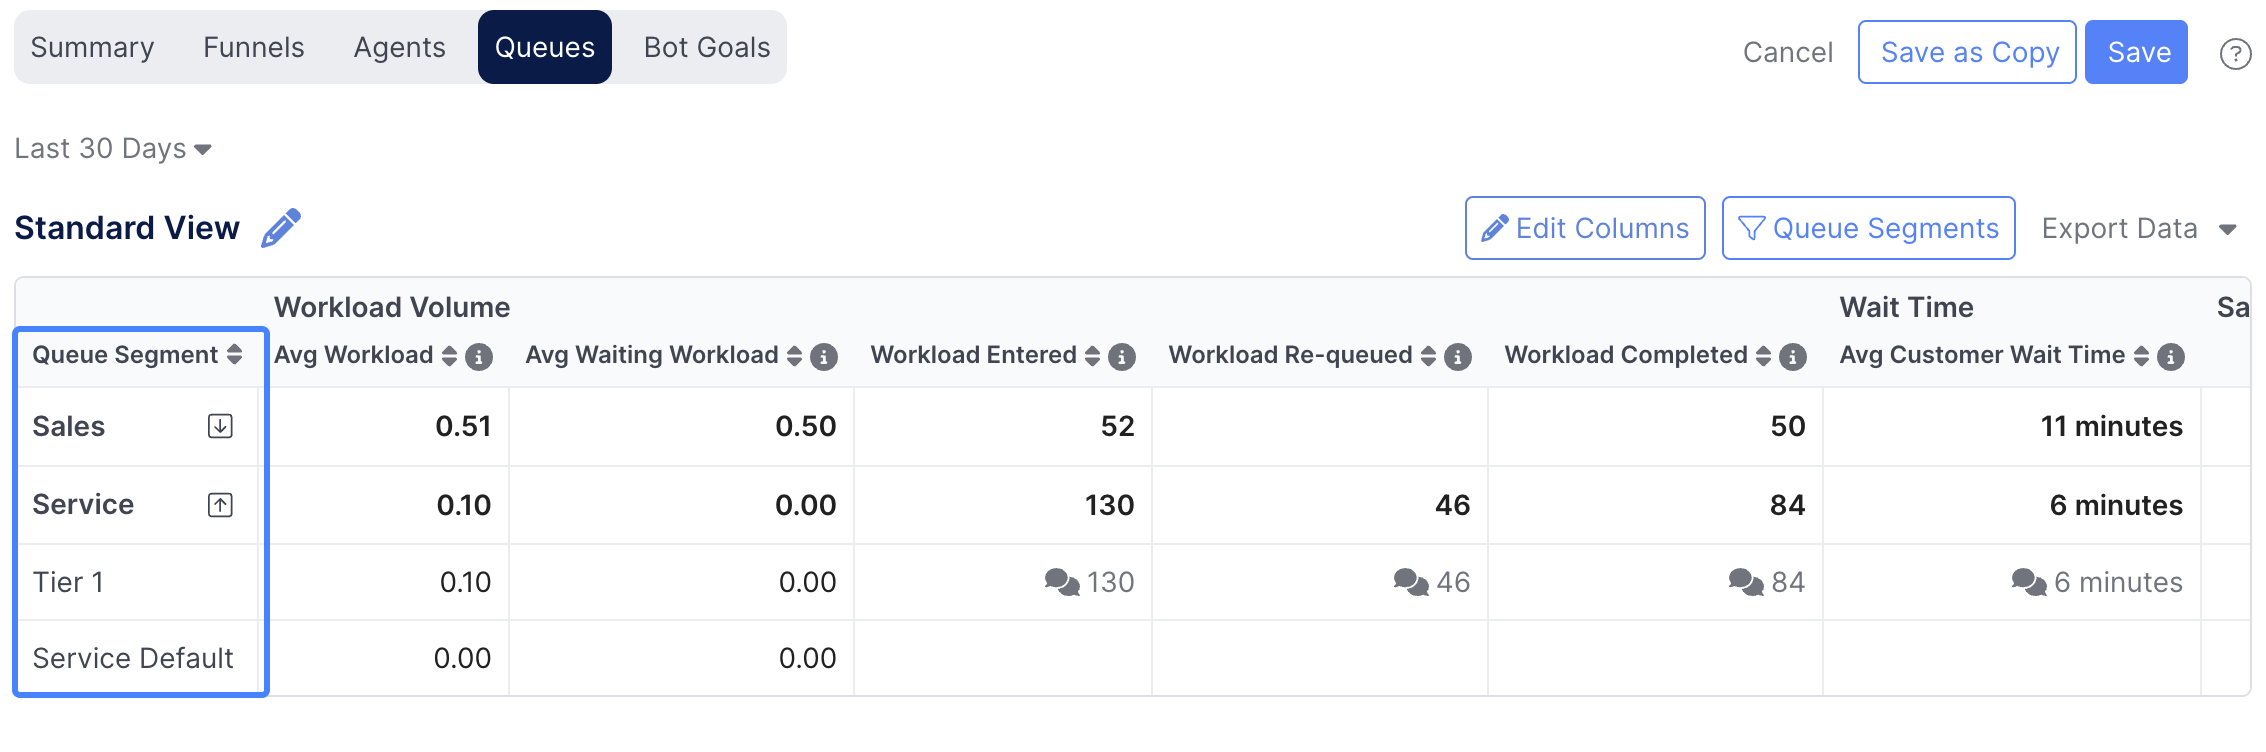
Any segment can be expanded to view the data for the individual queues that belong to that segment:
Resolving Queue Segment Conflicts
Sometimes when multiple segments are selected, there will be conflicts if the same queue is a member of more than one of the defined segments. If at least one queue matches one or more of the selected segments, the Queue Segmentation Conflicts dialog is automatically opened.
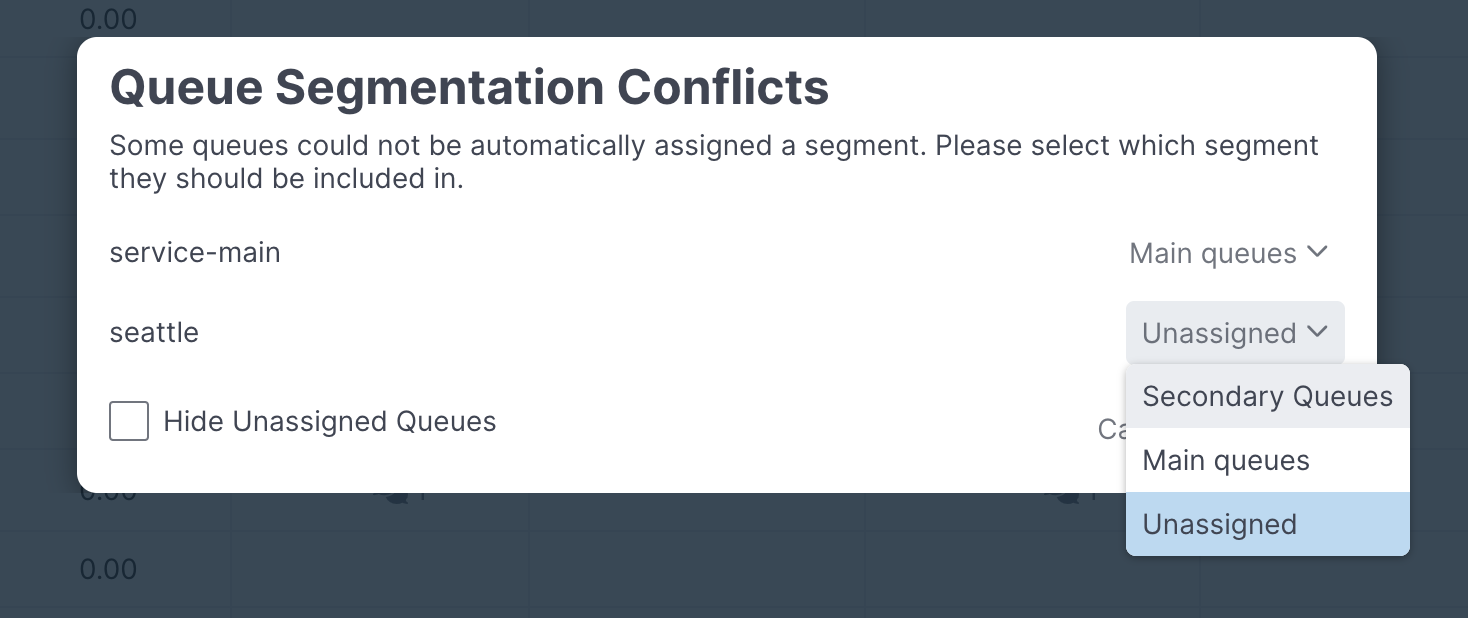
Every queue that matches more than one segment will be listed. By default, each queue is listed with the Unassigned segment.
Any queue can be left associated with the Unassigned segment, and the results will show an Unassigned grouping along with those for the selected segments. Each queue will only be listed with one selected segment.
Save the View
When changes have been made by editing the View, or by applying segmentation, Save buttons become available in the upper right:
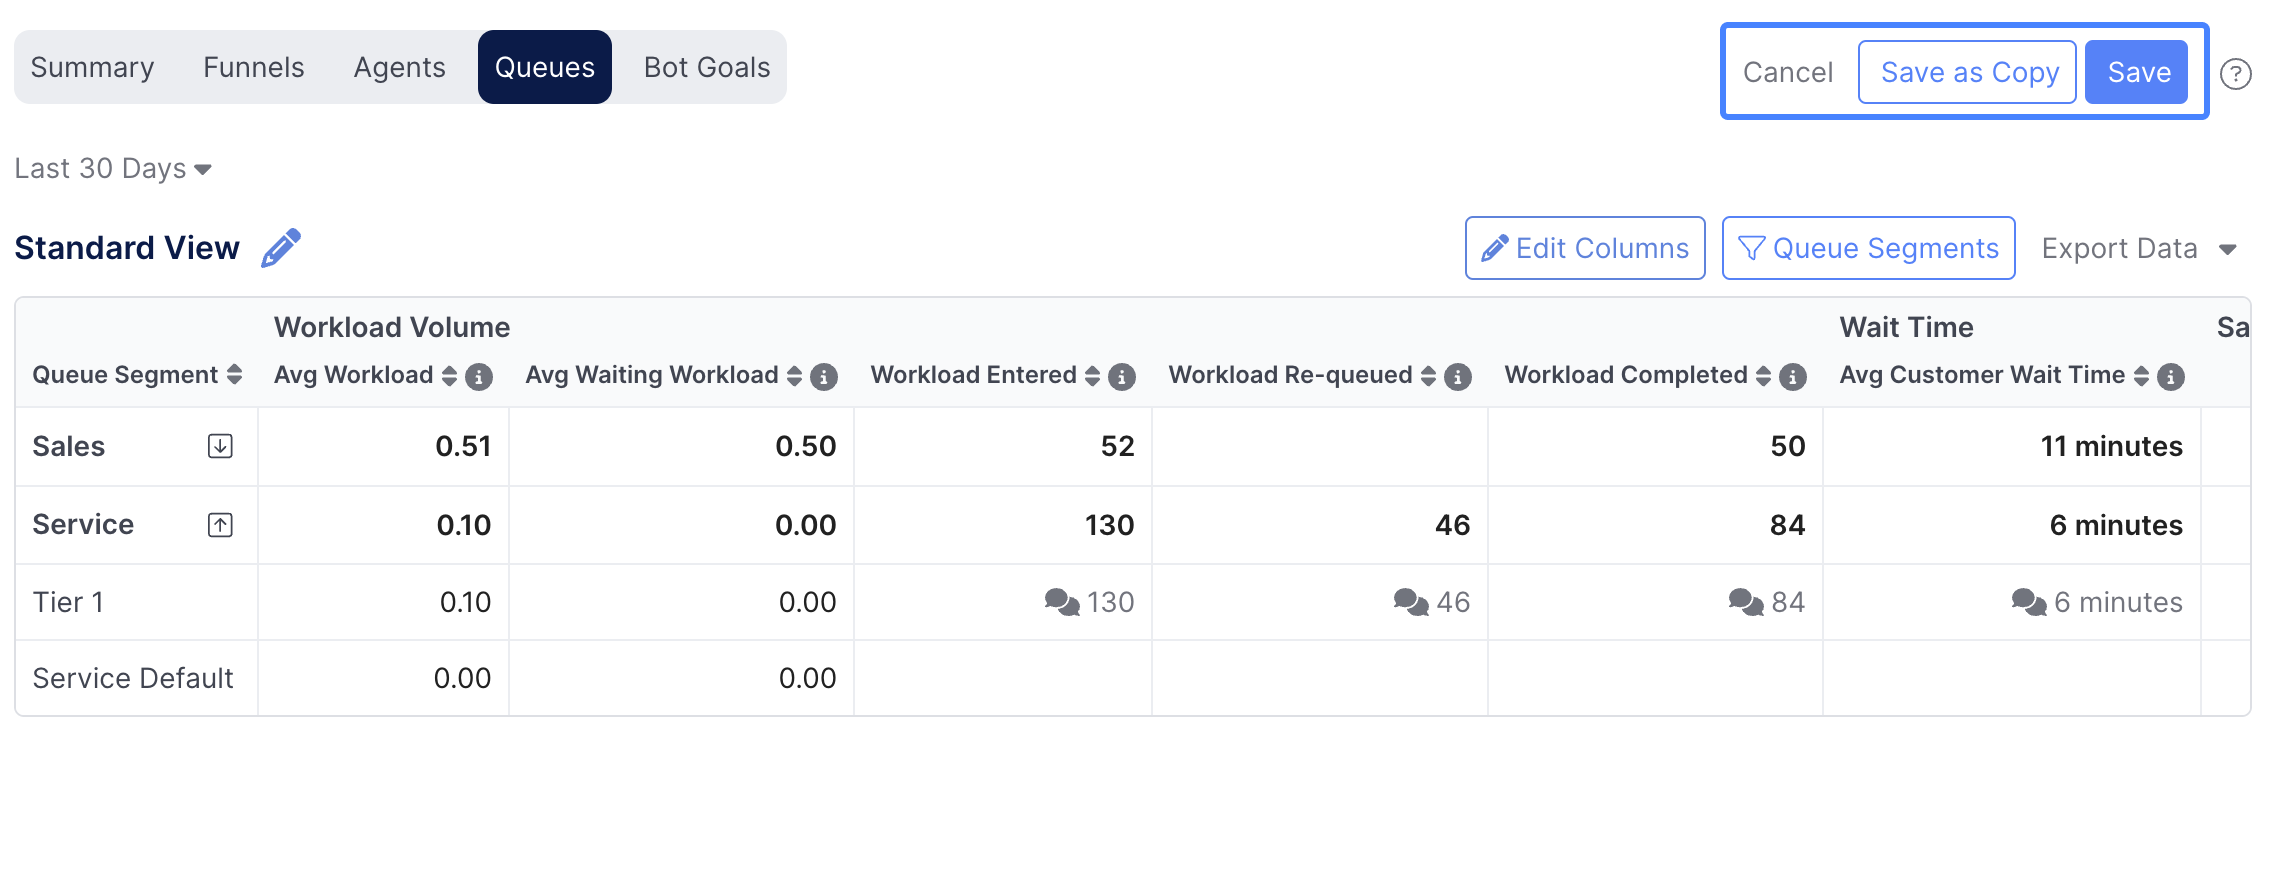
Save Copy allows you to create a new View with the current changes saved, leaving the current View unchanged.
Cancel will discard any changes.
Save will apply the changes to the currently selected View.
Reviewing Conversations for a Metric
To help analyze and review the data, any column that is a count of some conversation event supports drill-down. The columns are marked with a message bubble indicating that drill-down is available:
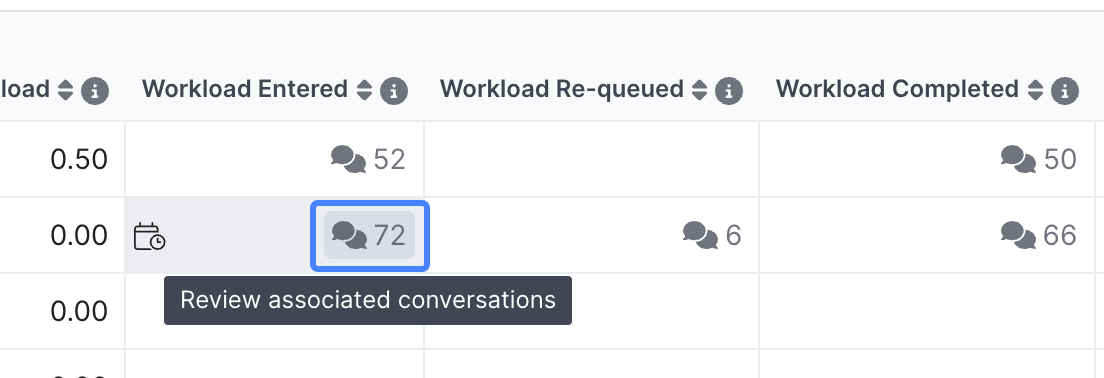
Selecting the bubble will open a drill-down pane that shows the conversations that were counted for that queue for the selected metric. Each conversation can be selected to show the transcript details that occurred around the time of the event:
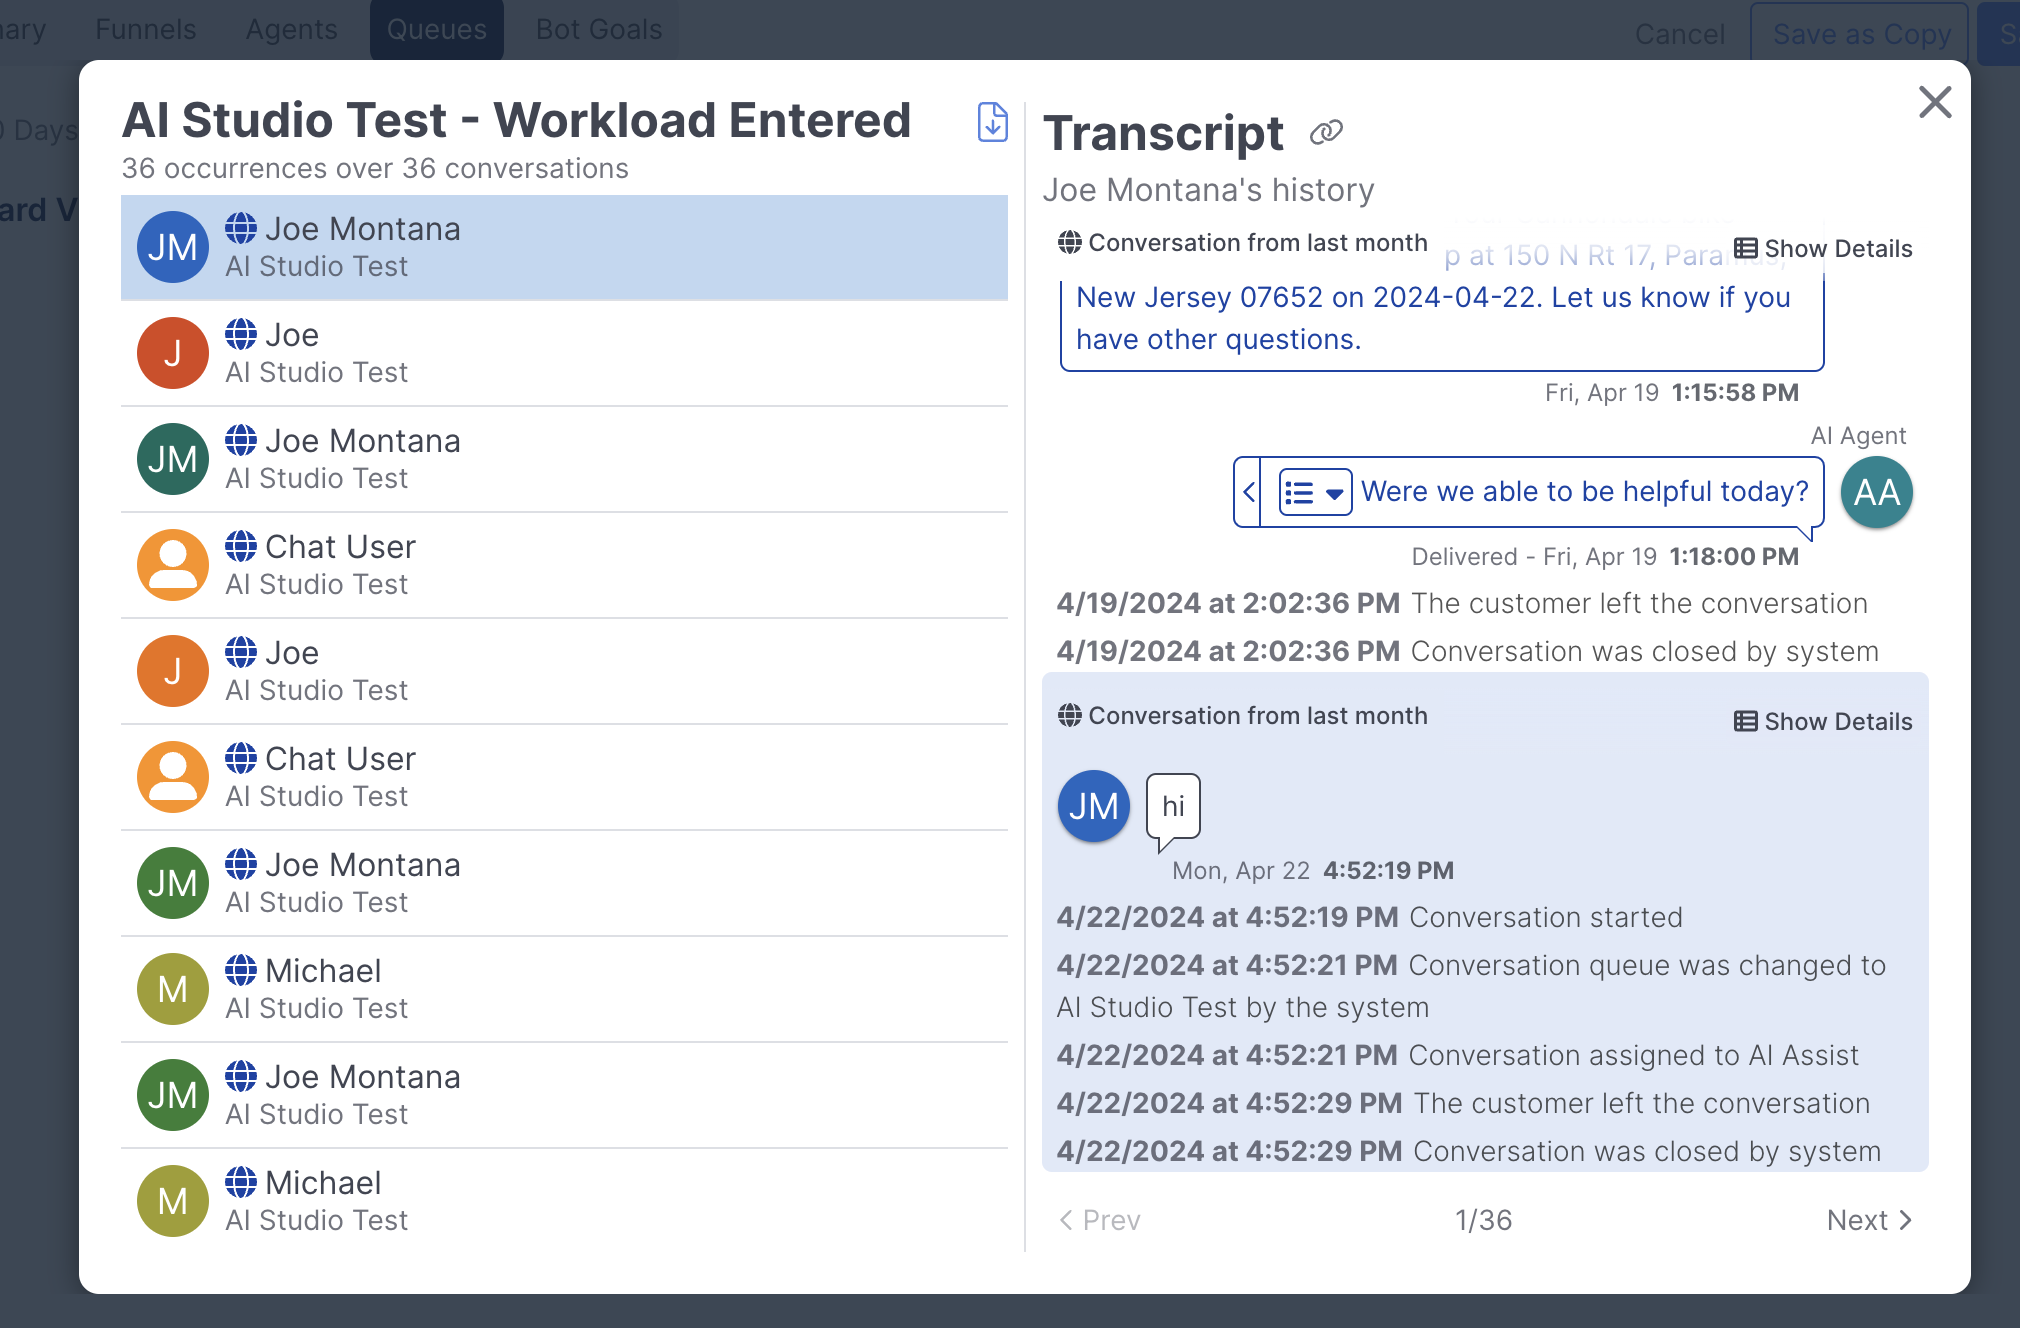
For example, if it was observed that some queue had a higher than average Conversation Re-queued number, the manager could review the conversation transcripts to gain insight into what was causing the conversations to be re-queued.
Time Series Drilldowns
Row Drilldowns
Row drilldowns are available to show all the metrics for a selected queue, or queue segment, broken down by Day, Hour, or Half Hour intervals. This allows one to further evaluate one particular queue, or queue segment, by time. Clicking the name of any queue will open a new time series row drilldown view:
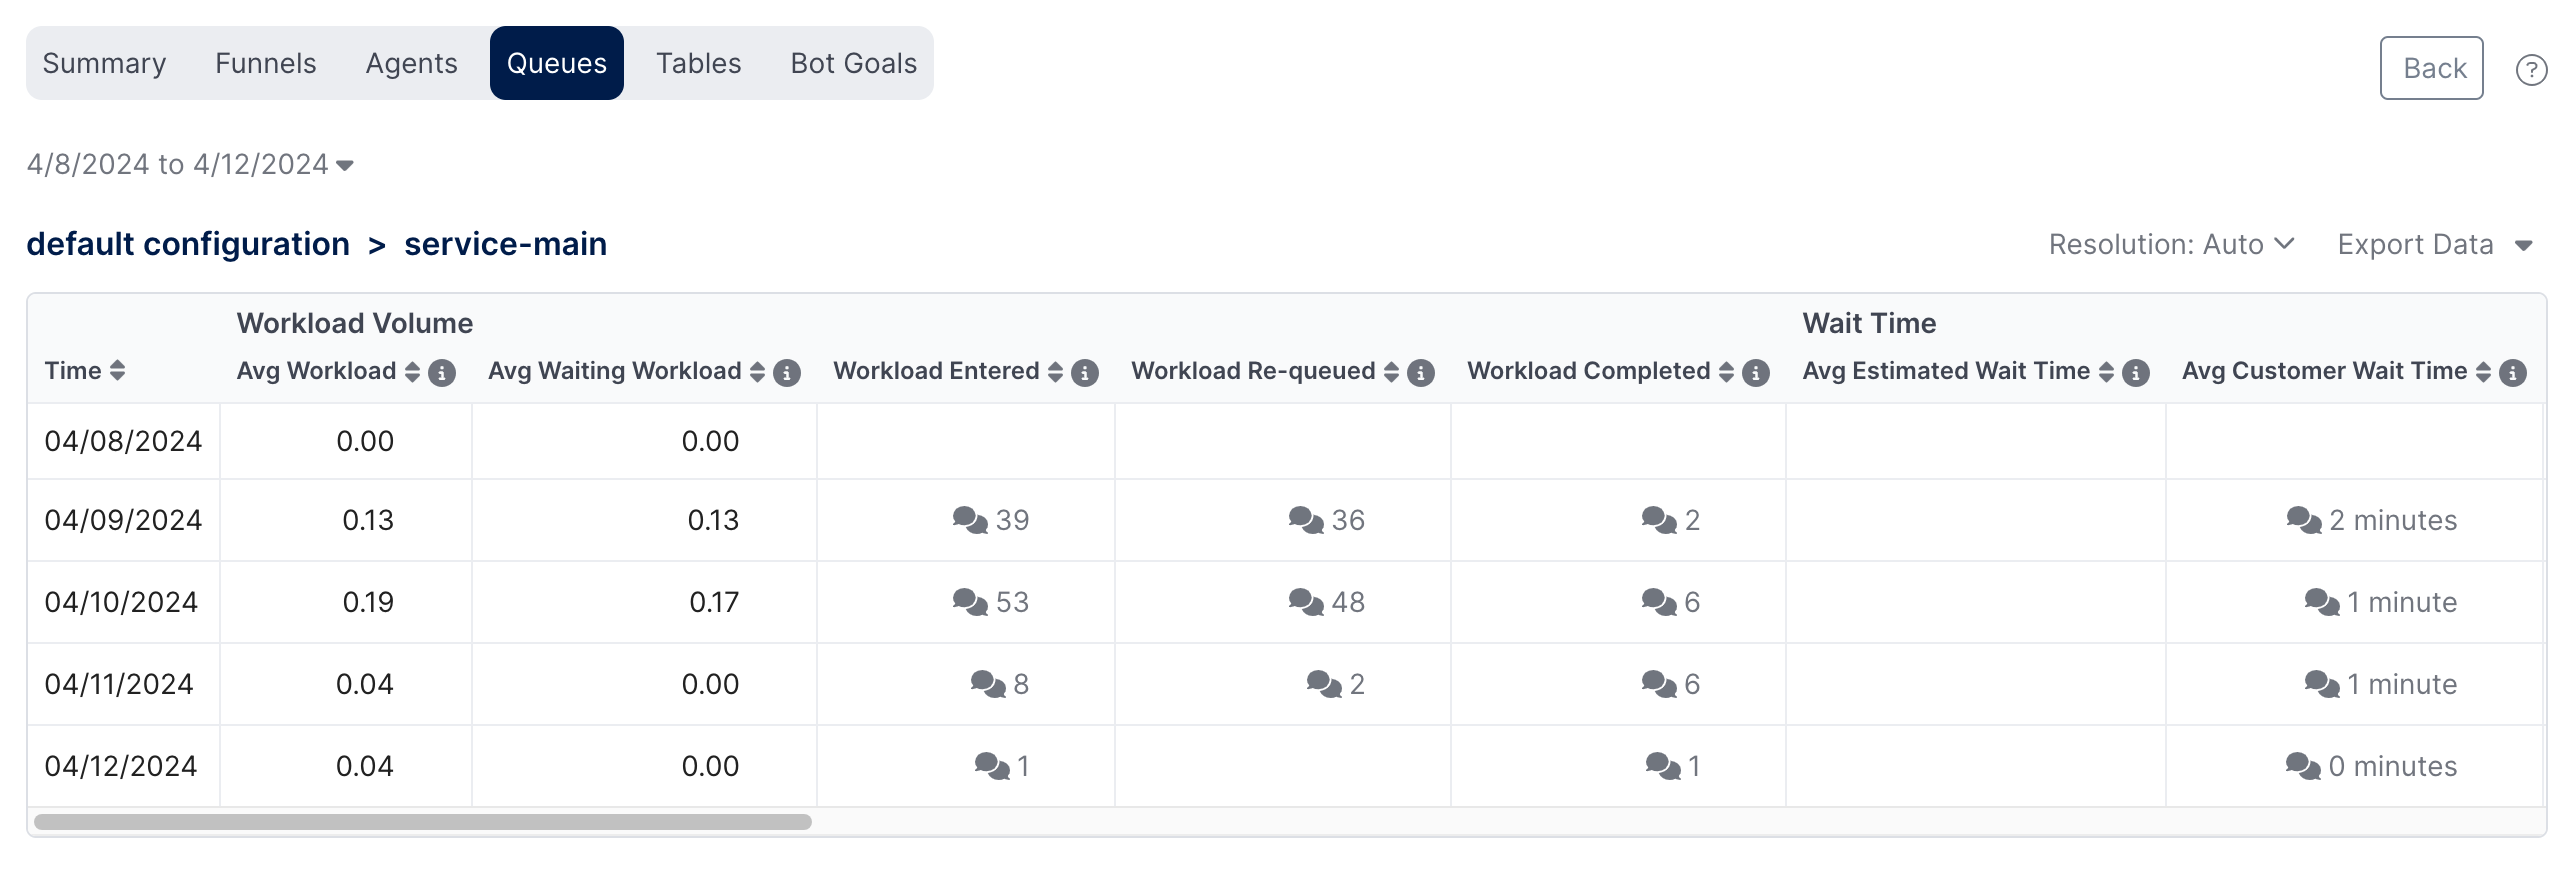
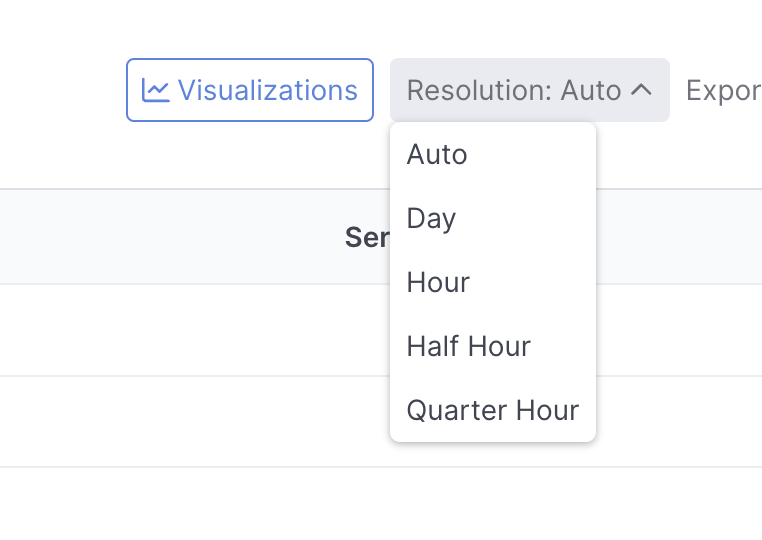
The Resolution will automatically set to Auto, letting the system decide what time units to use. It can be changed to , Day, Hour, Half Hour, or Quarter Hour:
A breadcrumb path displaying the name of the queue drilled into is available in the upper left to return to the parent view.
Column Drilldown
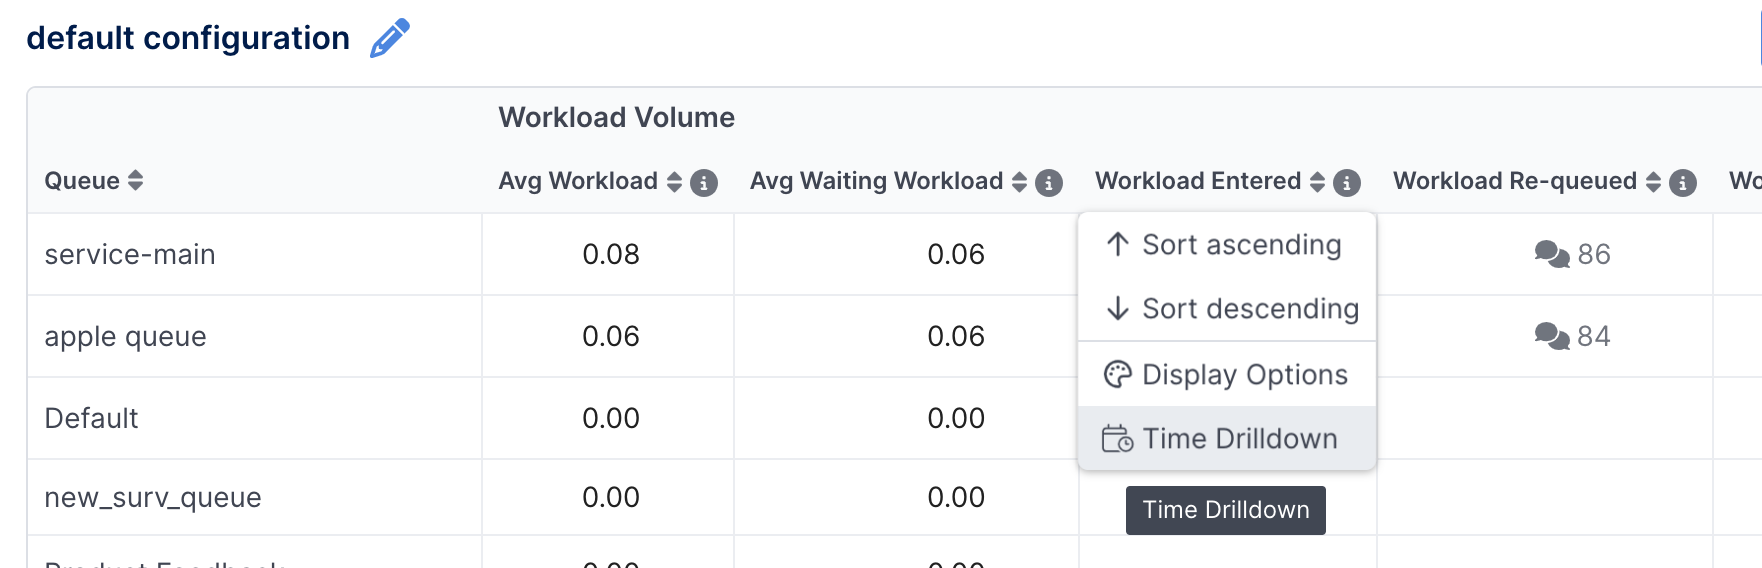
Column drilldown is available to show all the queue data for one selected metric broken down by Day, Hour, or Half Hour intervals.
To access a column drilldown select the Time Drilldown from the options menu in the column heading:
The column drilldown view will be displayed for the selected metric. This allows one to further evaluate one particular metric by time.
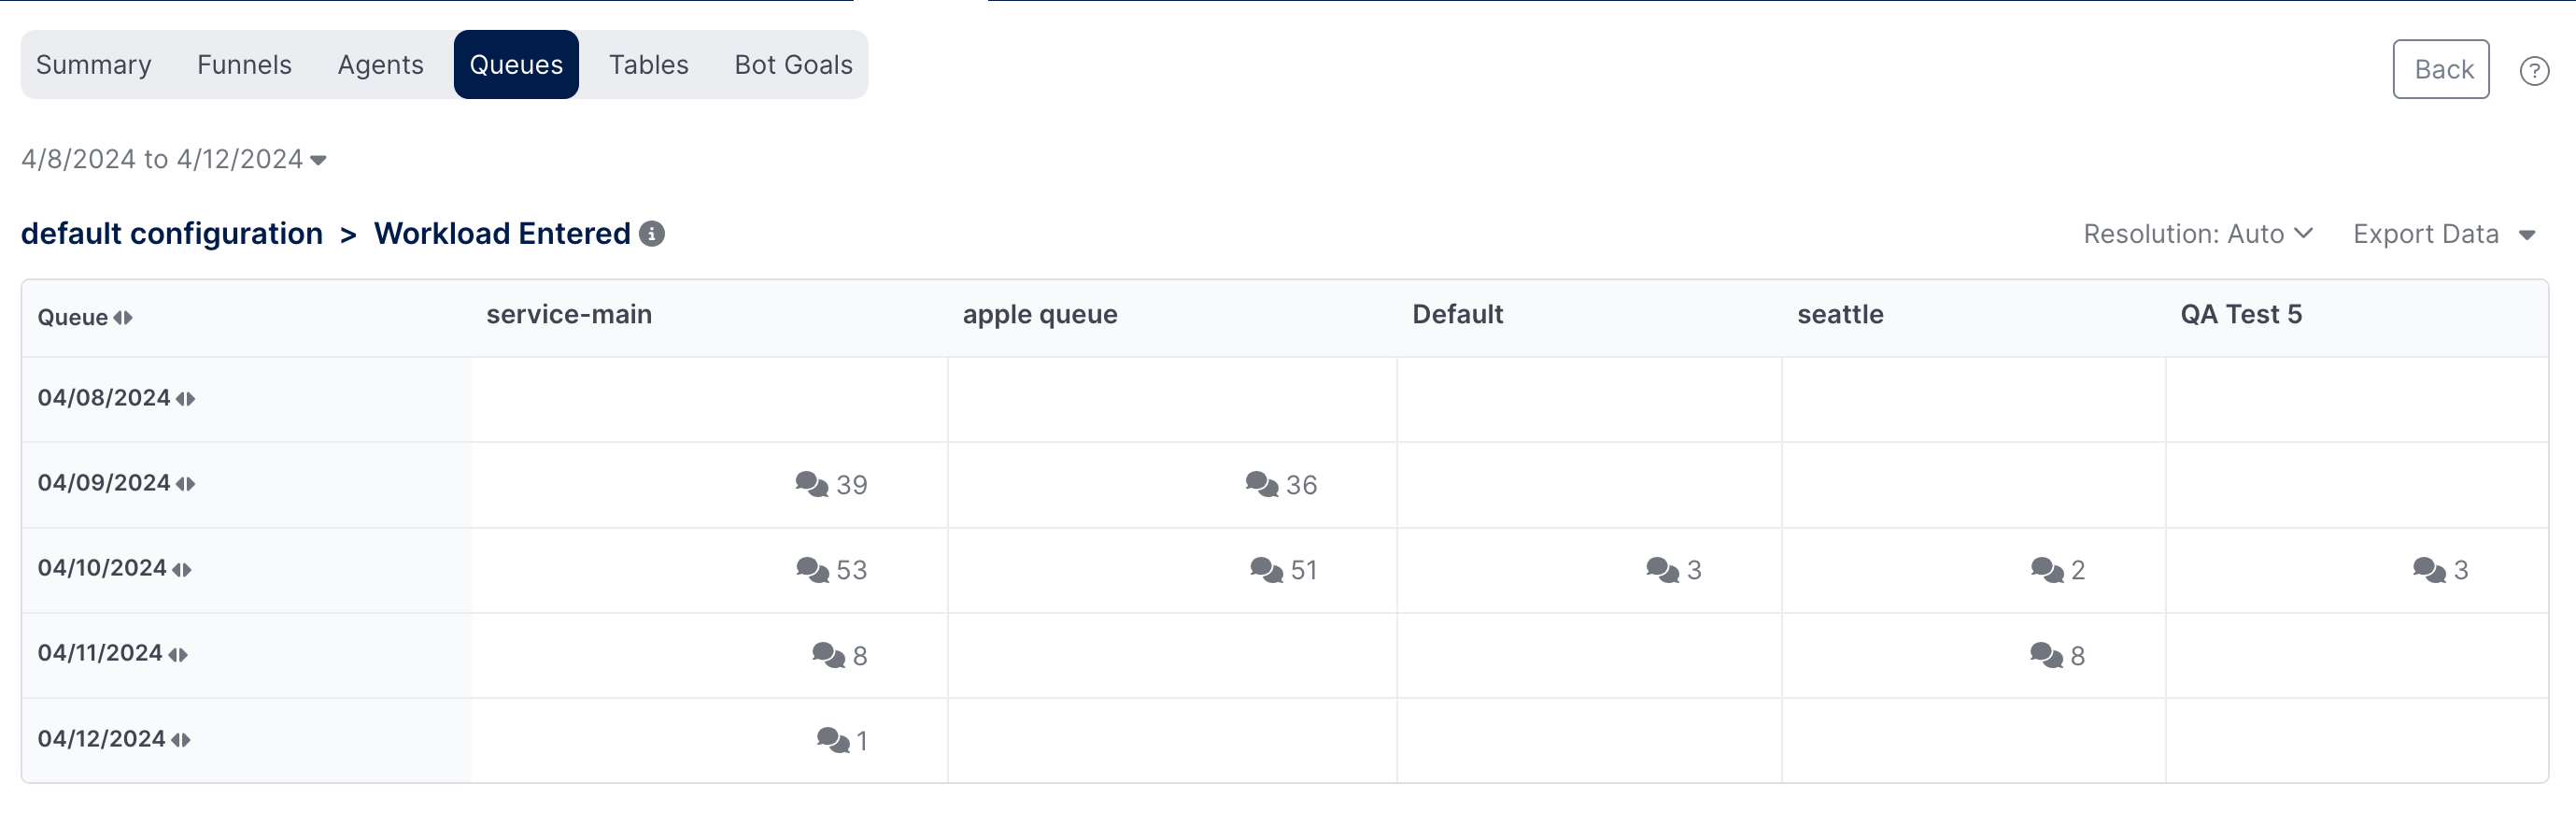
The Resolution will automatically set to Auto, letting the system decide what time units to use. It can be changed to Hour, Day, Half Hour, or Quarter Hour.
A breadcrumb path displaying the name of the metric drilled into is available in the upper left to return to the parent view.
Cell Drilldown
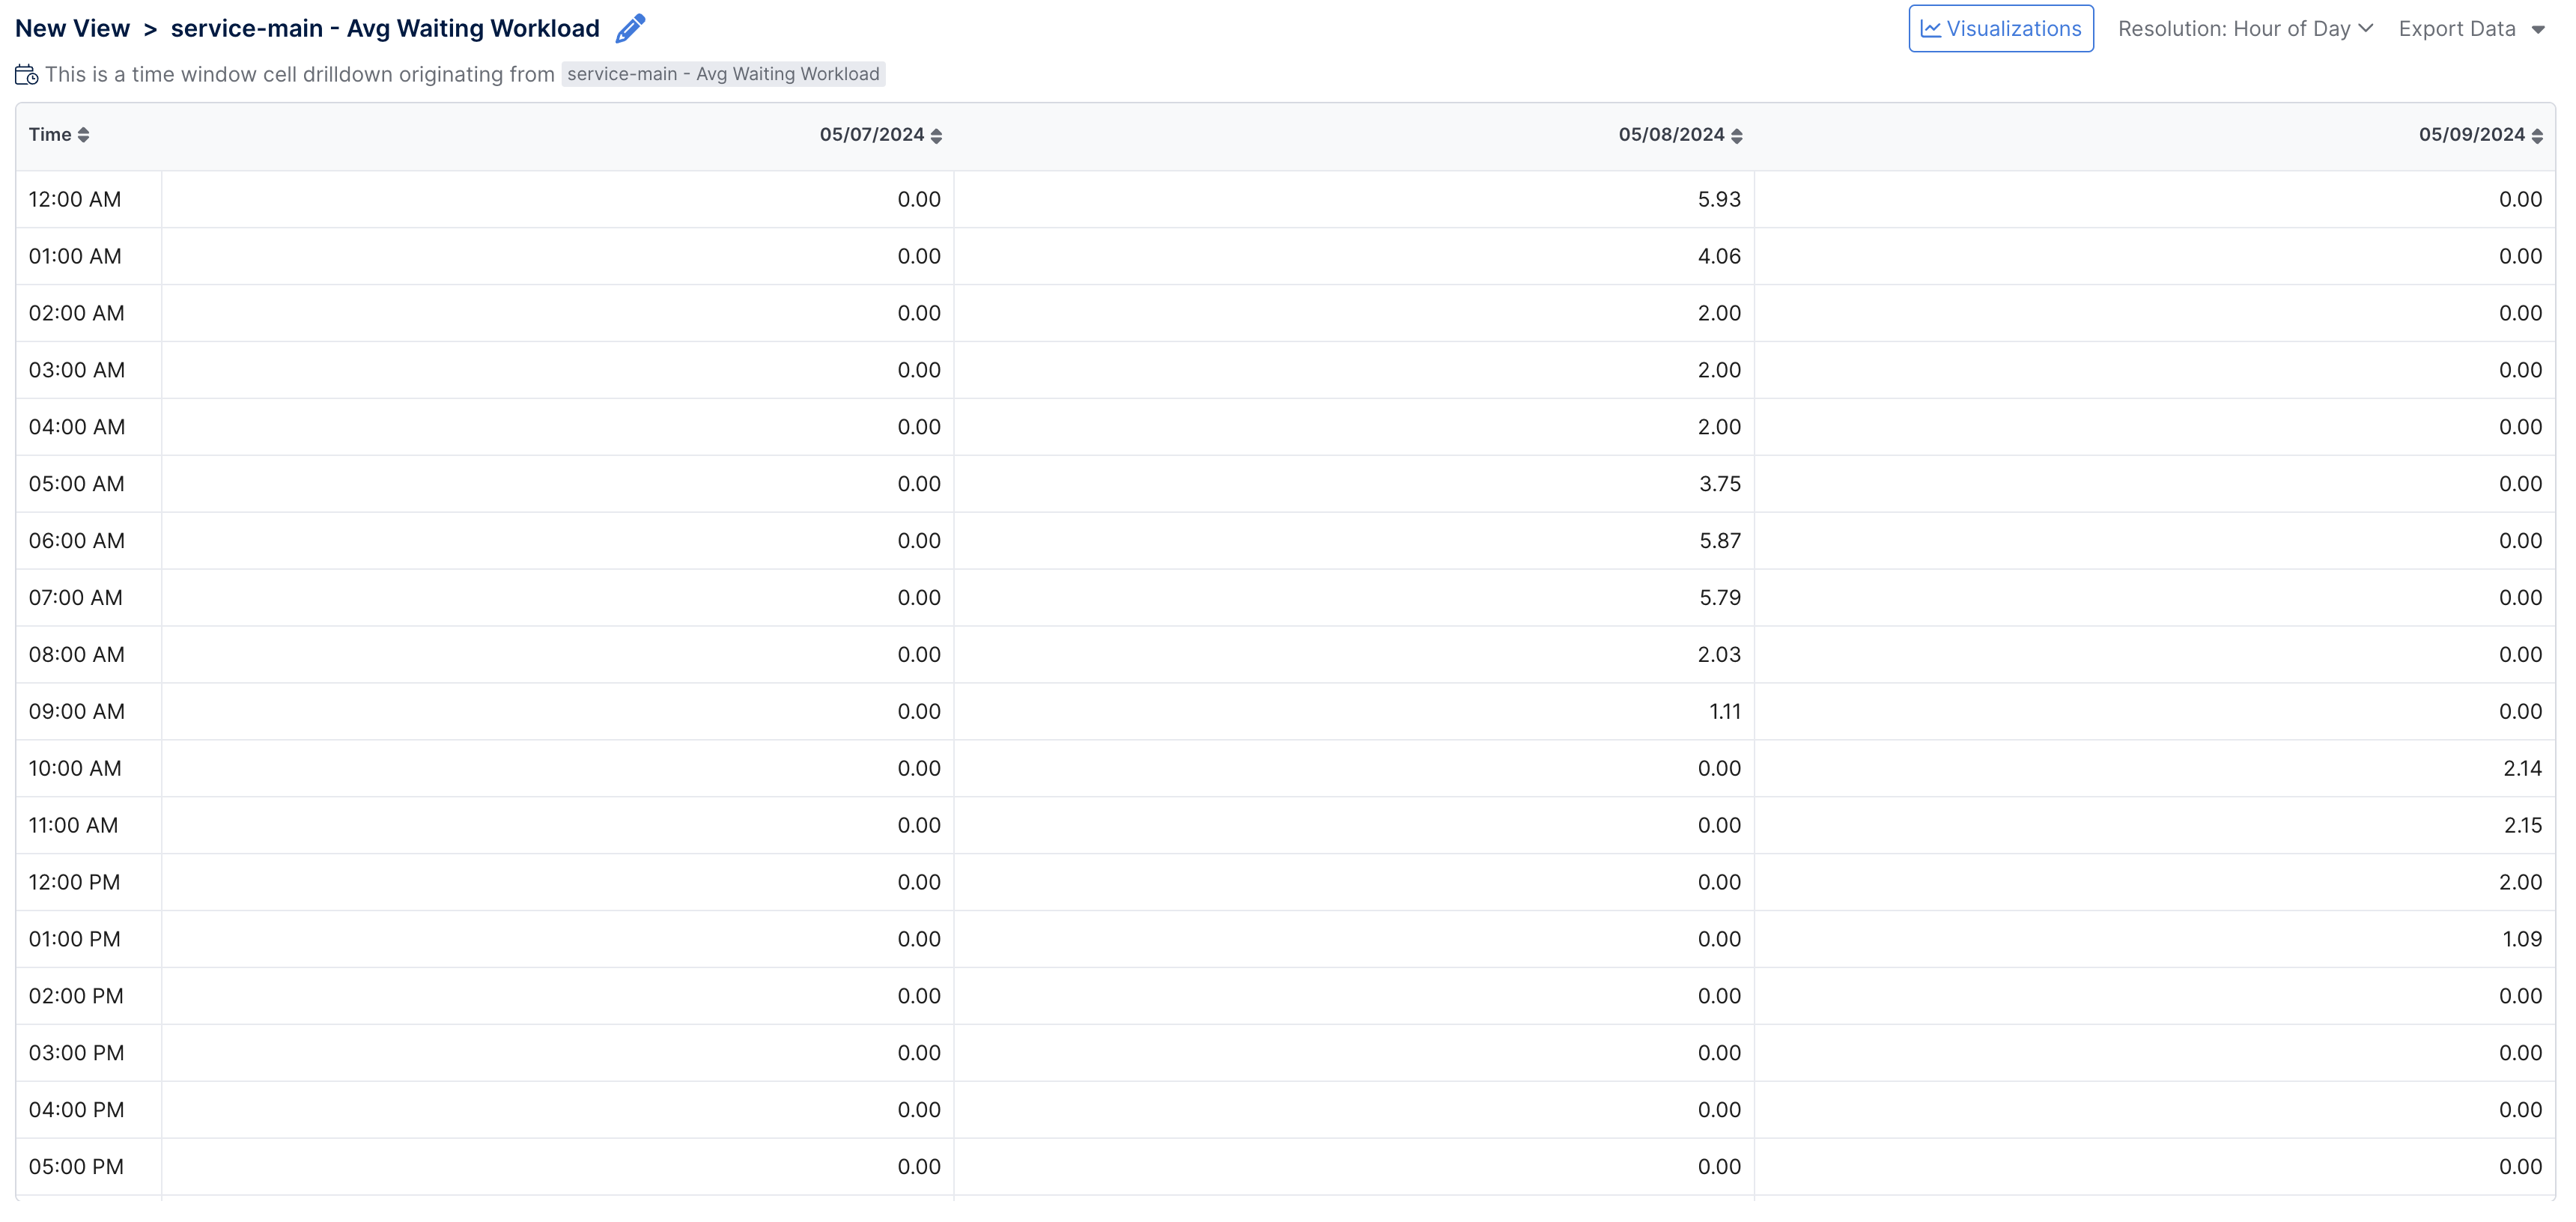
Cell drilldown is available to show the data for one particular queue, or queue segment, and one metric broken out into a table showing the data values per Day and per Hour (or Half Hour).
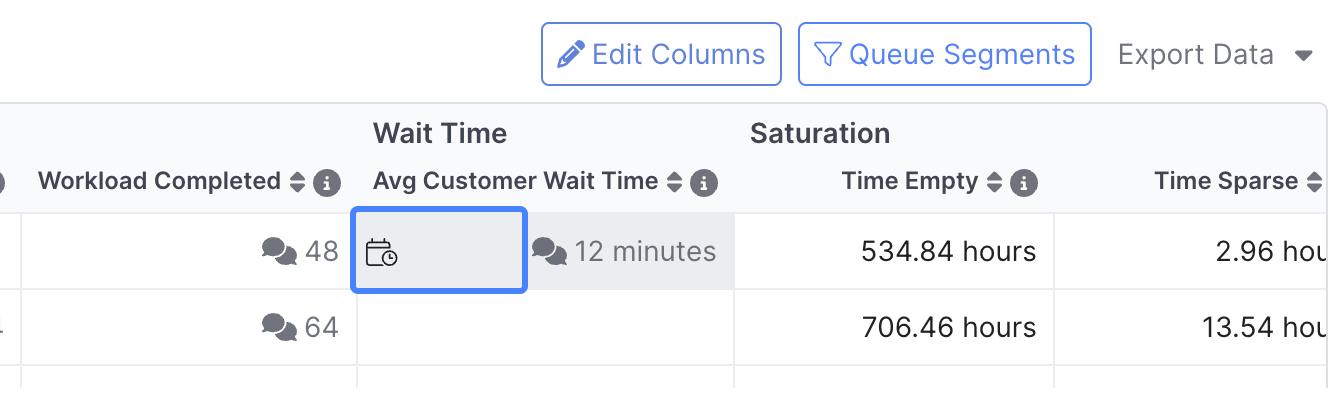
To access a cell drilldown, hover over a cell with data until the calendar button displays, then select the cell:
The column drilldown view will be displayed for the cell. This provides a "heat map" of the data by day (rows) and time of day (columns) for the selected metric and queue.
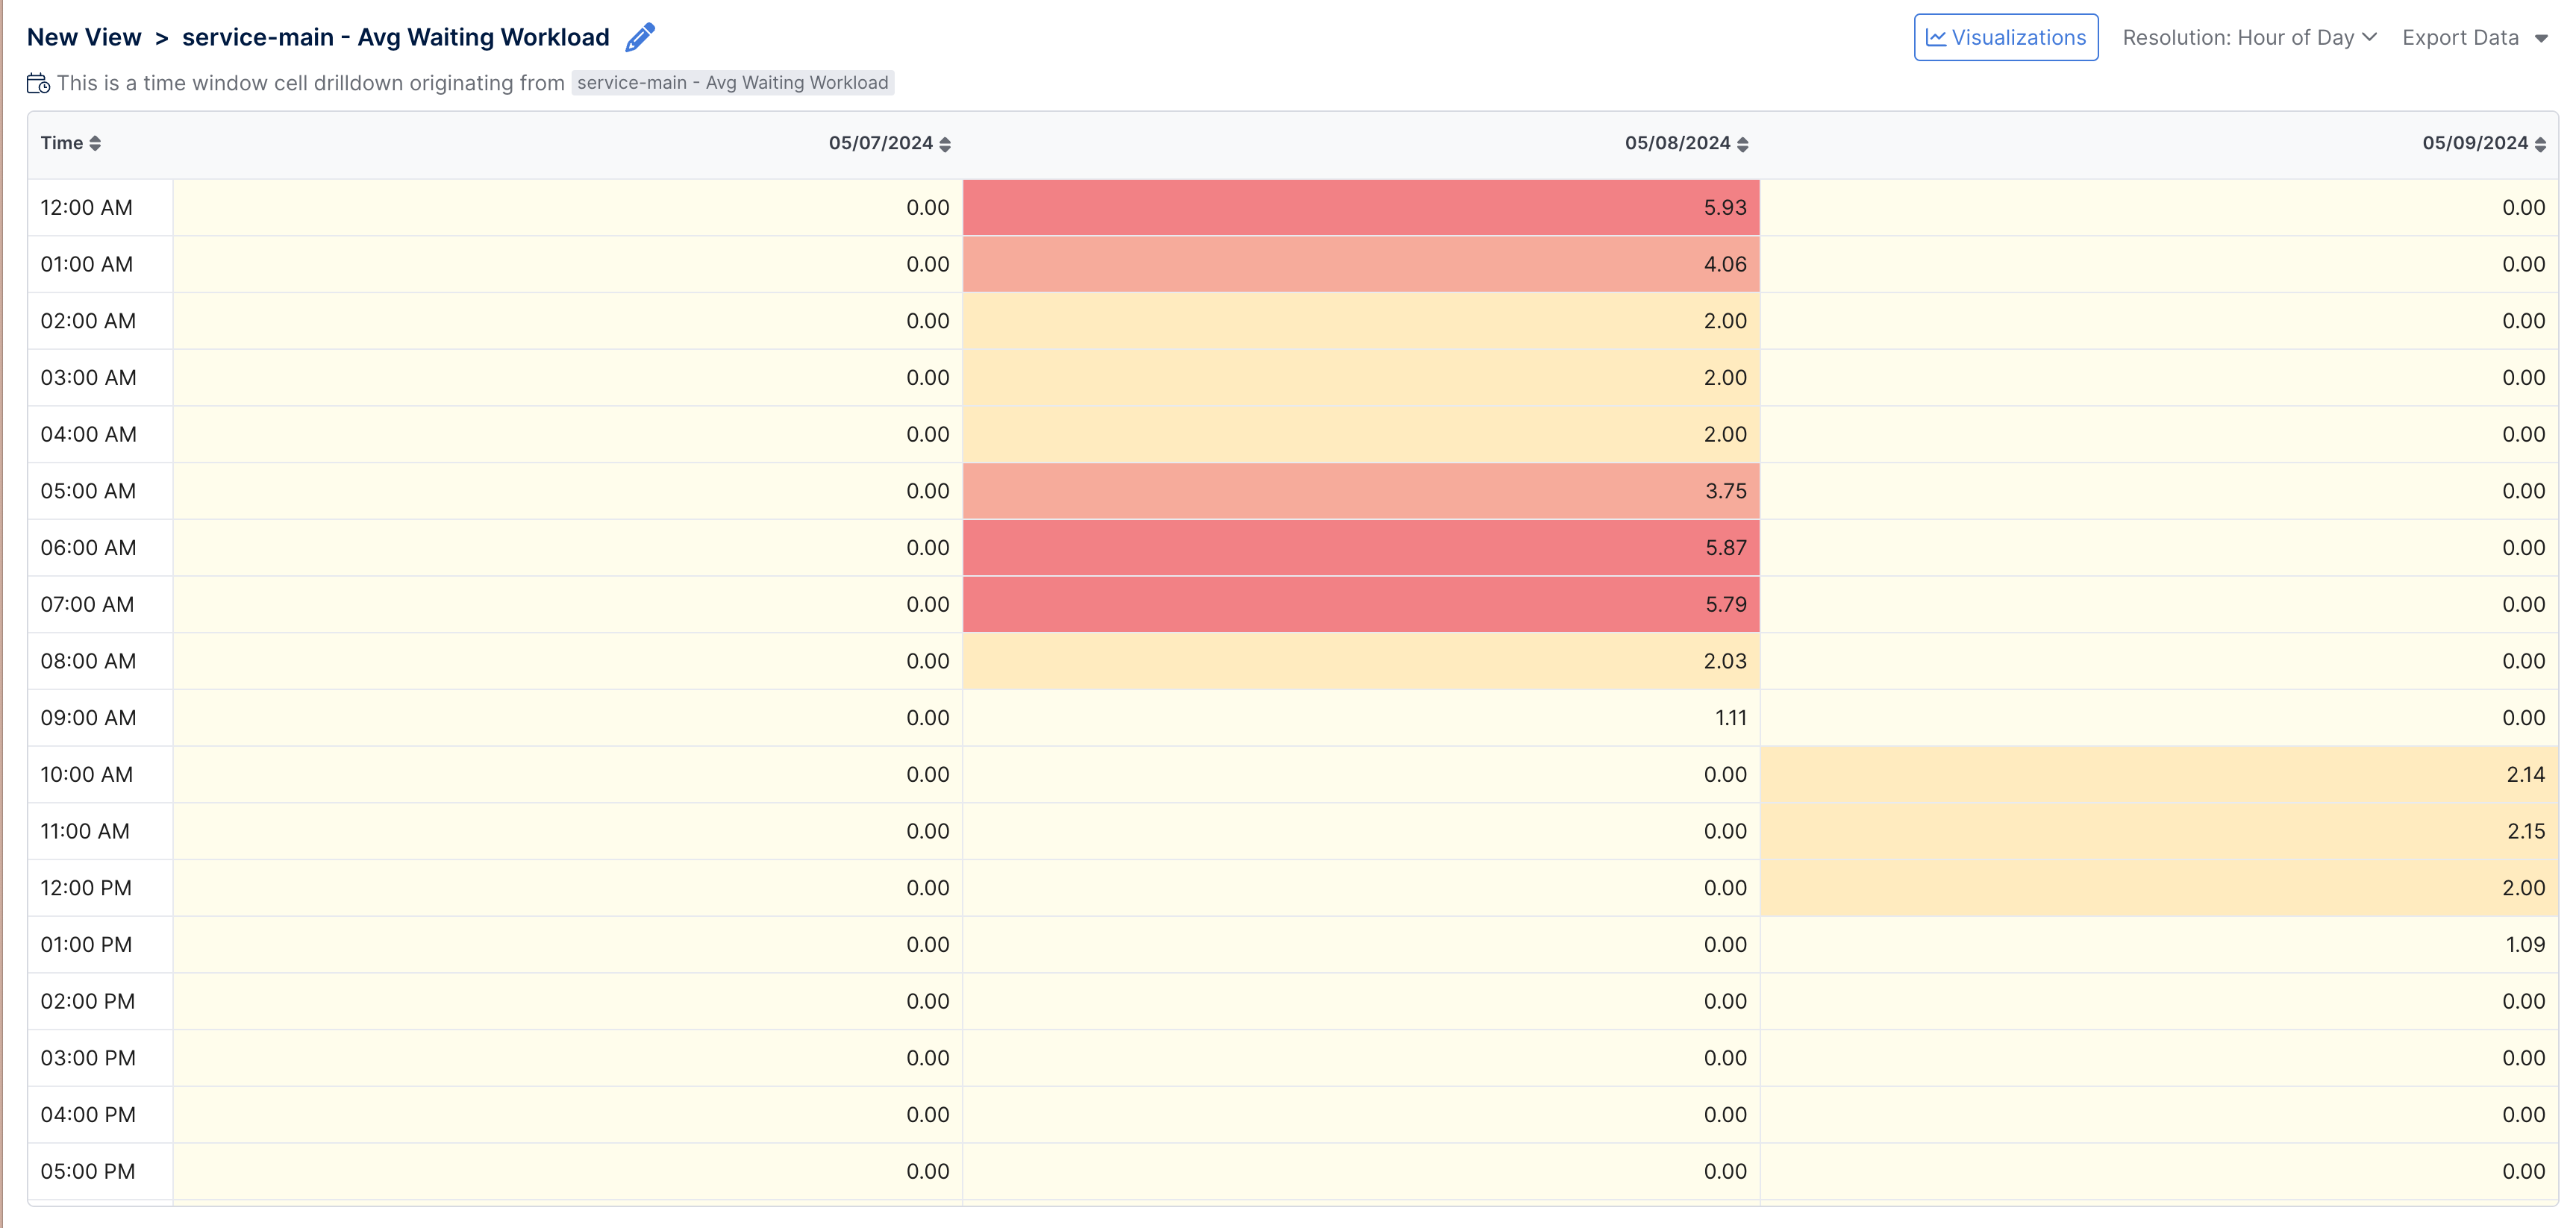
Selecting the Visualization button in the upper right will allow you to add color to the table such that the higher "hot" values appear in red. This can quickly identify any time periods with higher than normal values. Enable the background coloring by checking the Show heat map checkbox in the dialog.
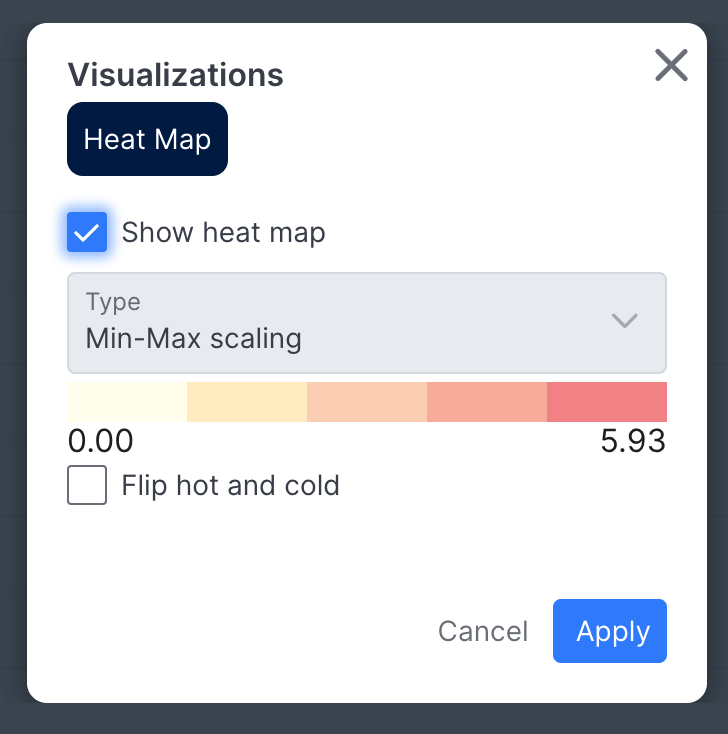
Hitting Apply will then show the background coloring for the heat map in cell drilldowns.
The Resolution will automatically set to Auto, letting the system decide what time units to use for columns. It can be changed to Hour, Half Hour or Quarter Hour.
A breadcrumb path displaying the name of the queue and metric drilled into is available in the upper left to return to the parent view.
Saving a Drill-down View
When in any drilldown, administrator users have the option to save the report as a view. This view is then available at the view list on the main Queue Insights screen. This allows a user to directly open a heat map or some other time series breakdown of the selected queue(s) or metrics.
These views behave differently than standard Insights views since they are always defined to be associated to a particular metric, queue (or queue segment) or both. One cannot Edit Columns, change Queue Segments, modify Display Options, or do additional time drilldowns from these views. The data can still be viewed and exported for different date ranges.
The time series drilldowns are flagged with the calendar icon after the name in the main List View:
Managers can drill down on views they have access to, but cannot save new views.
When using a selected date interval of more than 1 month, and choosing a Resolution of Hour_or_Half Hour, the results will be truncated to include only the first month in the selected date interval. The Day option will allow the user to see all the data in the time period.
Exporting Data
You can export the data into a CSV formatted file by selecting Export Data from the top toolbar. Two options are available:
Queue Data - Display options are ignored and data will be returned in raw format
Queue Data Formatted - Display options are maintained and the CSV file will contains the data in the same units and decimal precision as seen when viewed on the screen.
Only the columns available in the view are included in the CSV file.
Queue Insight Metrics
You can view all available metrics and definitions in the Queue Insights Metrics section.