
Breakdowns
Overview
Breakdown Insights allow Quiq Administrators and Managers to develop reports providing a set of metrics and KPIs grouped by some defined category. Agent Insights and Queue Insights are available as standard reporting to display performance metrics grouped by agent or queue. Now, other reports can be customized to show data broken down by some other piece of data - the topic set by a Conversation Analyzer, a contact point, a platform, a custom field or a property on a custom event. The user can then drill in to breakdown the data further by other pieces of information.
Admins can create and save different Breakdown Reports that highlight different metrics for different lines of business. Those can then be shared with Admins, Staff Admins & Managers within your organization.
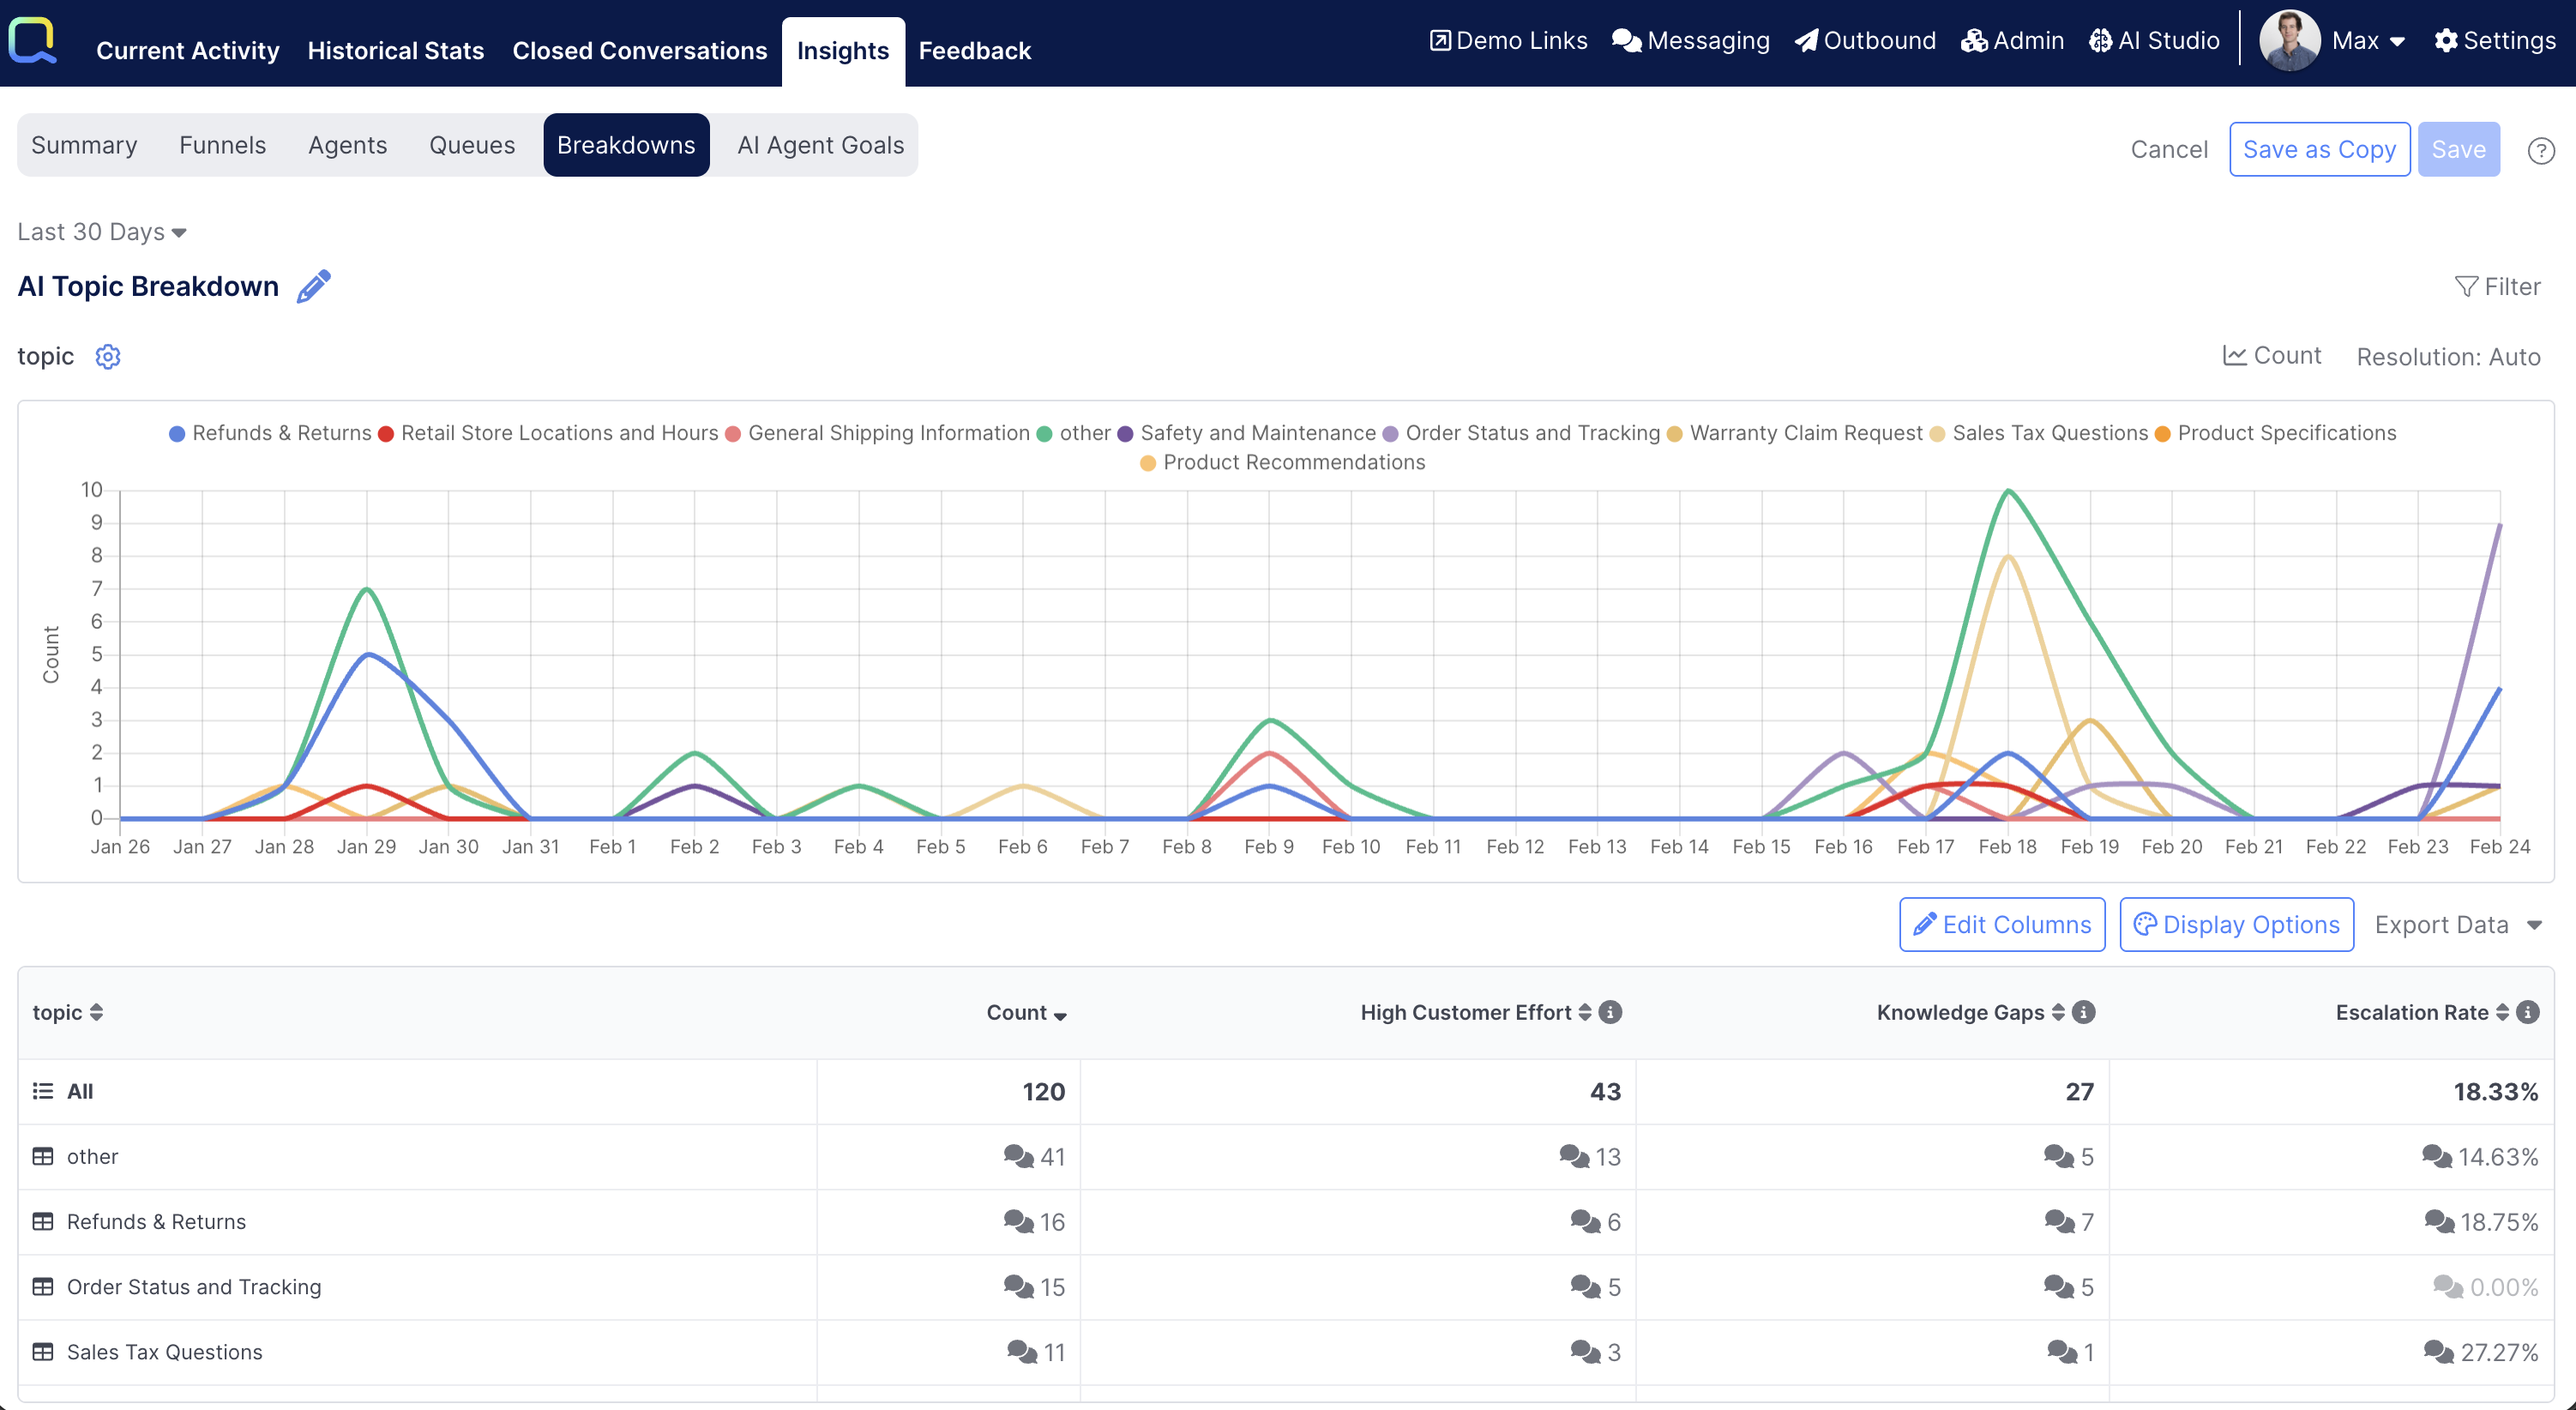
Each report will automatically show information in four main areas:
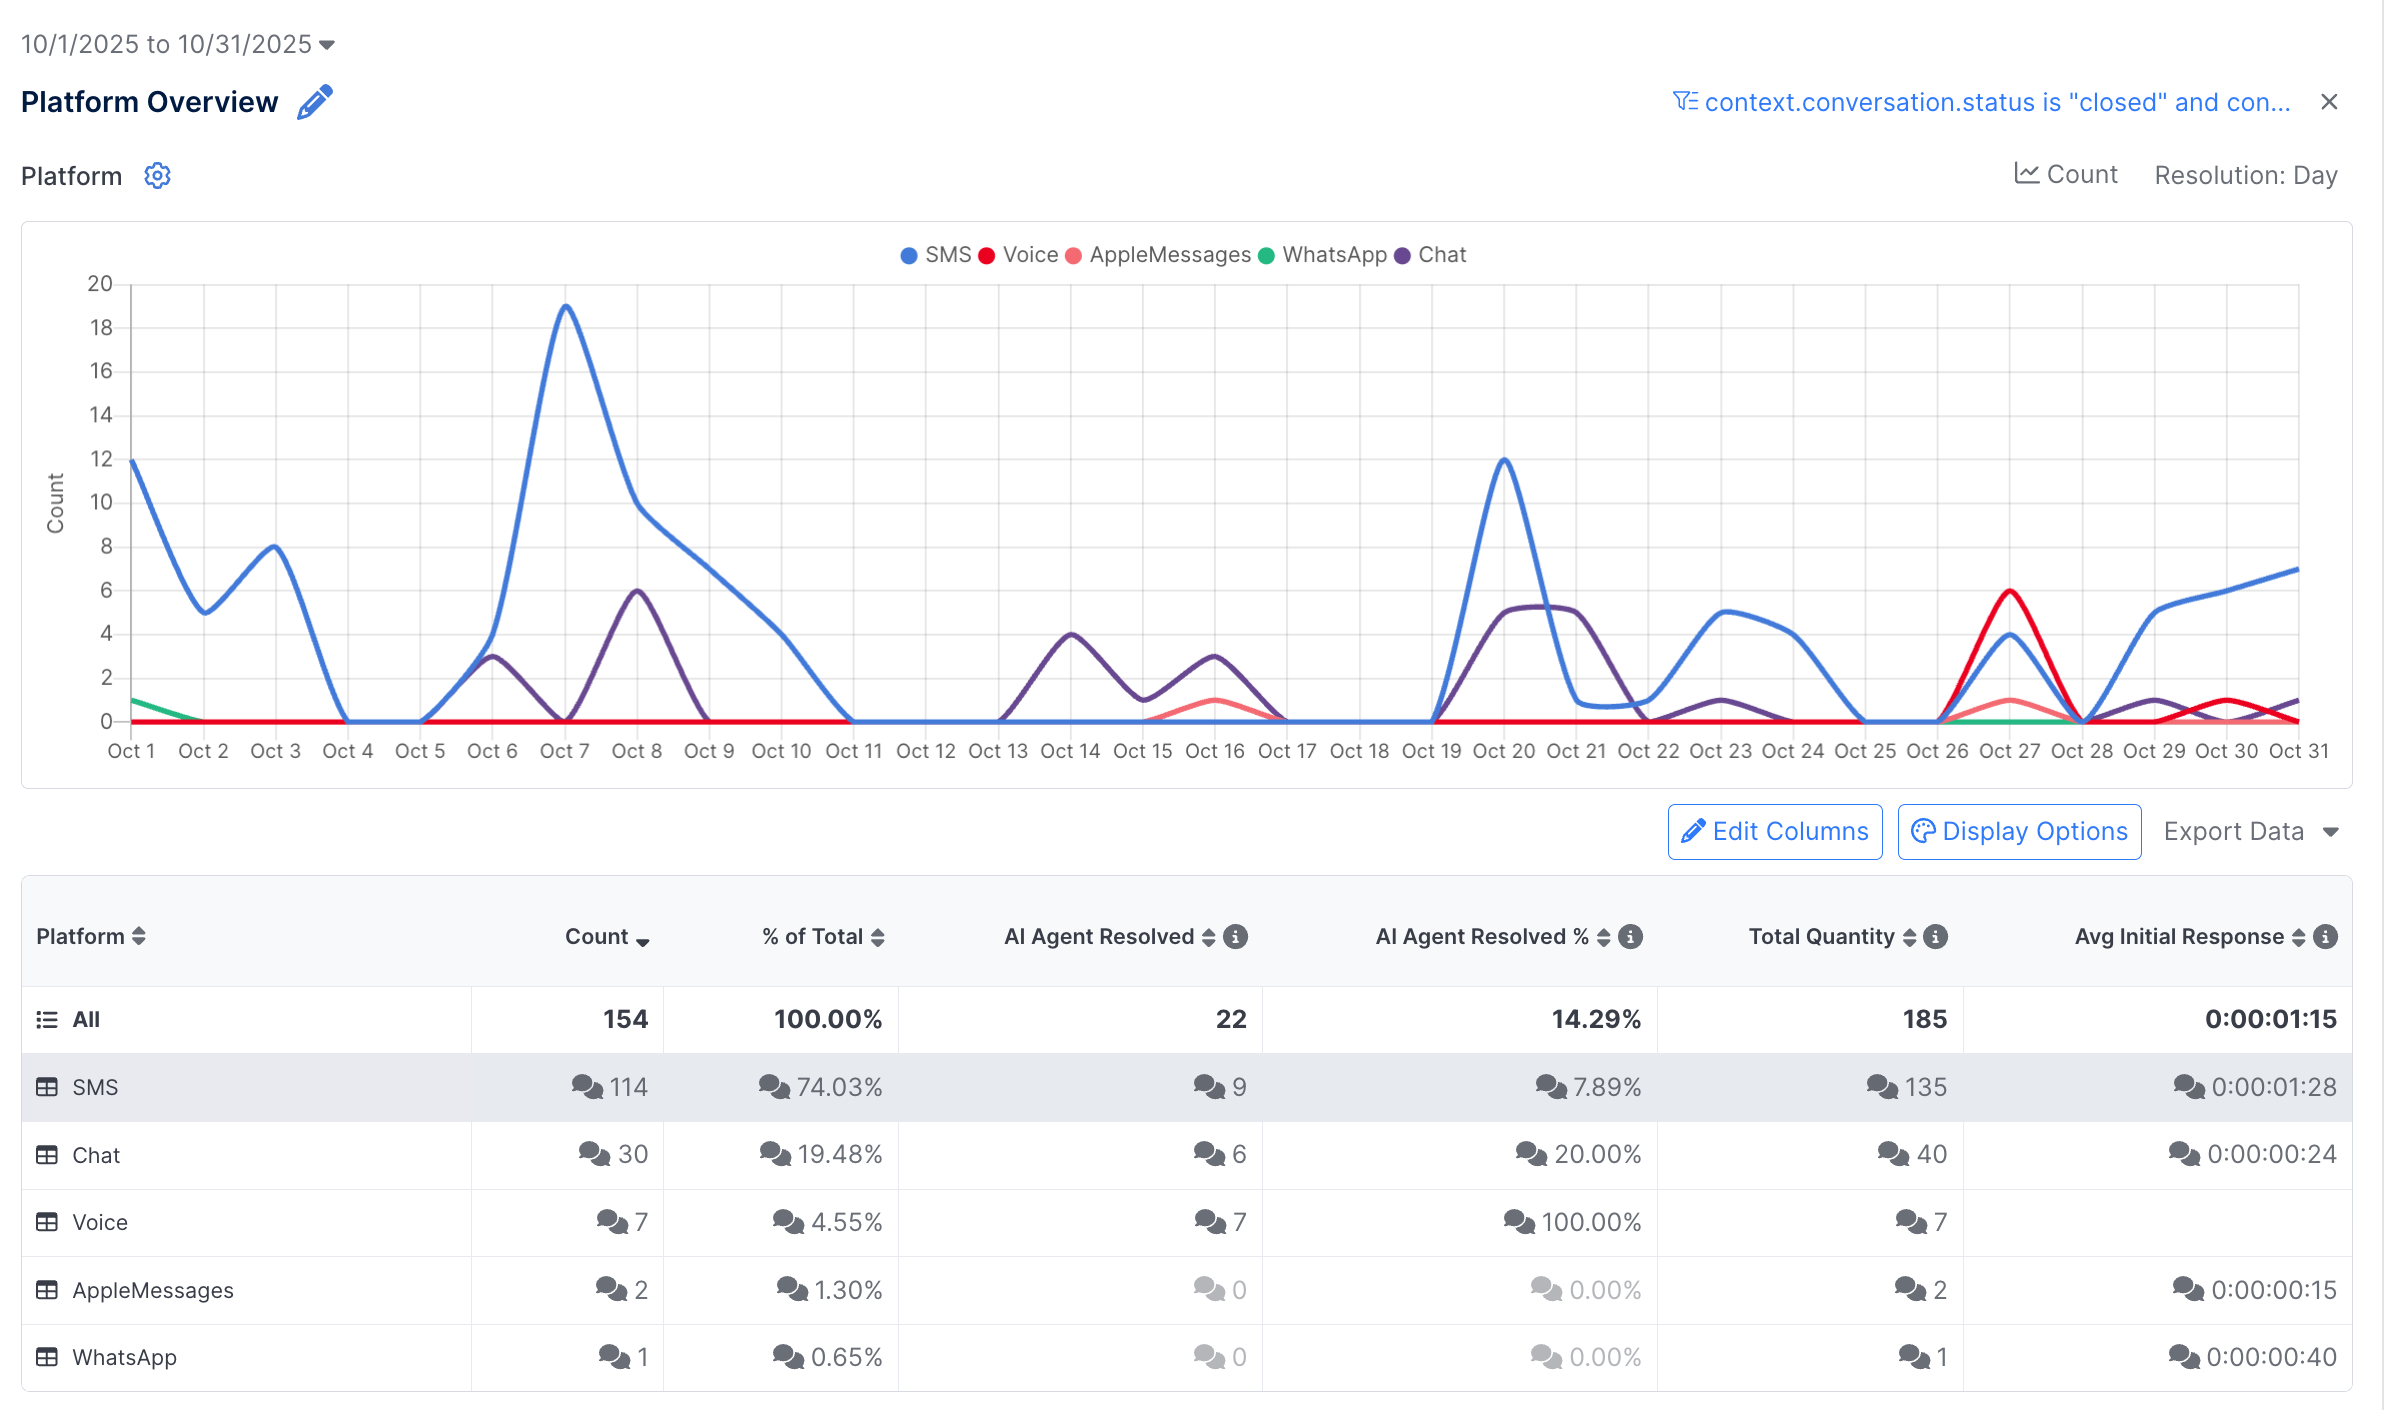
- A line chart displaying a breakdown of the values for each defined category with a count of occurrences over time for the selected report date range.
- A table containing a list of the values for the breakdown field along with the total counts of occurrences during the time range.
- The display can be drilled into to either see the data broken down further by another category, or to view a list of the individual events (conversations) that matched the criteria.
- When viewing events another line chart is available that shows the number of events by time for the selected breakdown category.
Every breakdown report will be automatically configured to show a metric of Count to show the total number of events (e.g. Conversations Ended) that occurred during the selected timeframe. Additional metrics can be added as well.
Creating a New Report
The Reports > Insights > Breakdowns tab provides a list of reports that have been previously configured and are available to the user - similar to what is seen in the Funnels or Agents subtabs.
Admins will see all the Reports that have been created. Staff Admins and Managers will only see Reports they have been granted access to.
An admin will select the + New Report to create a new report. Only admin user can create new breakdown reports.
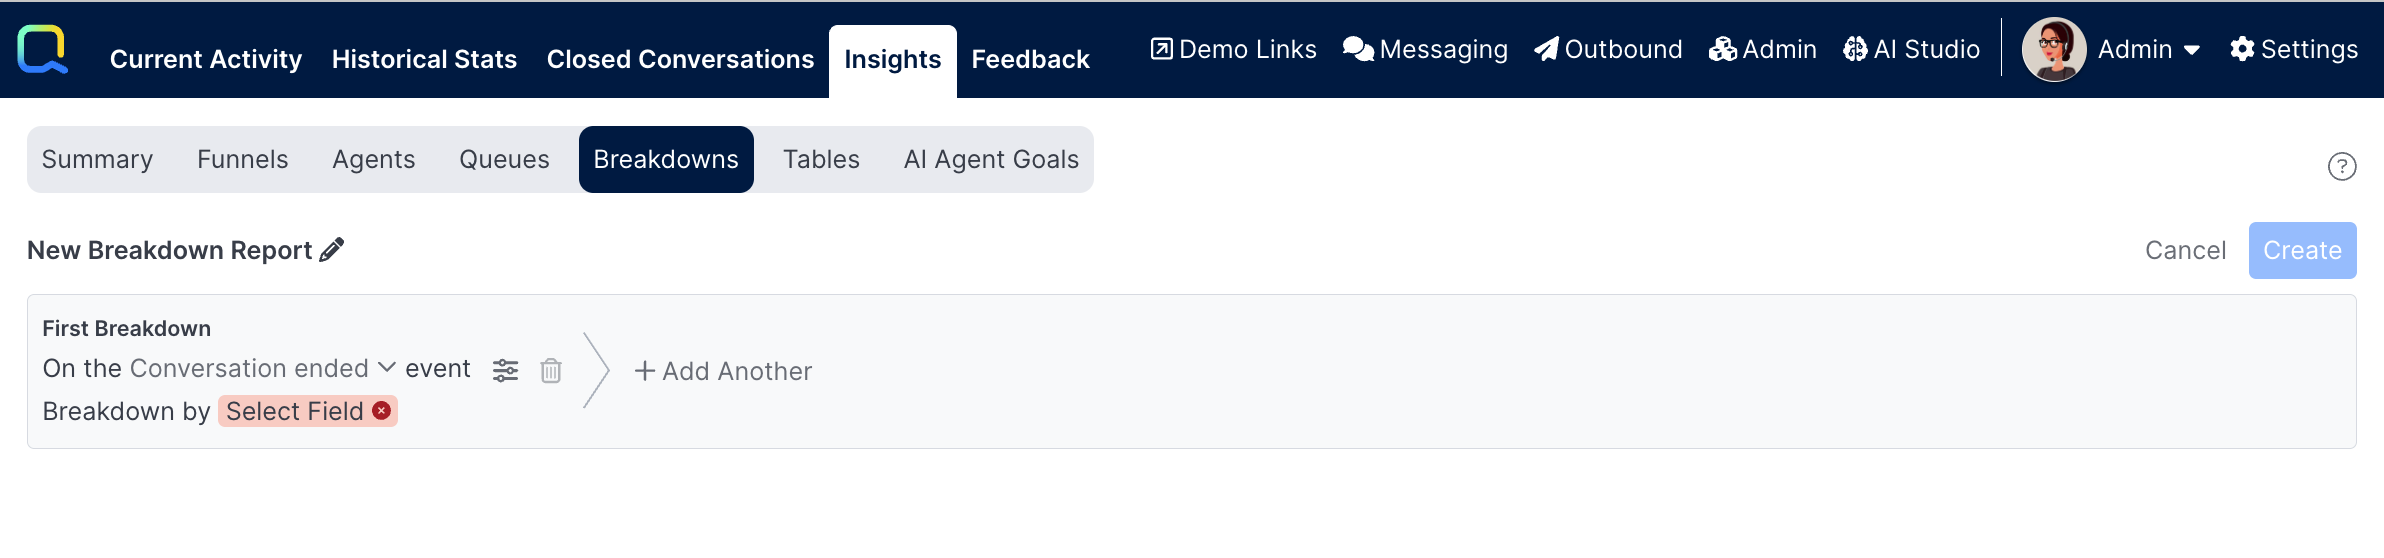
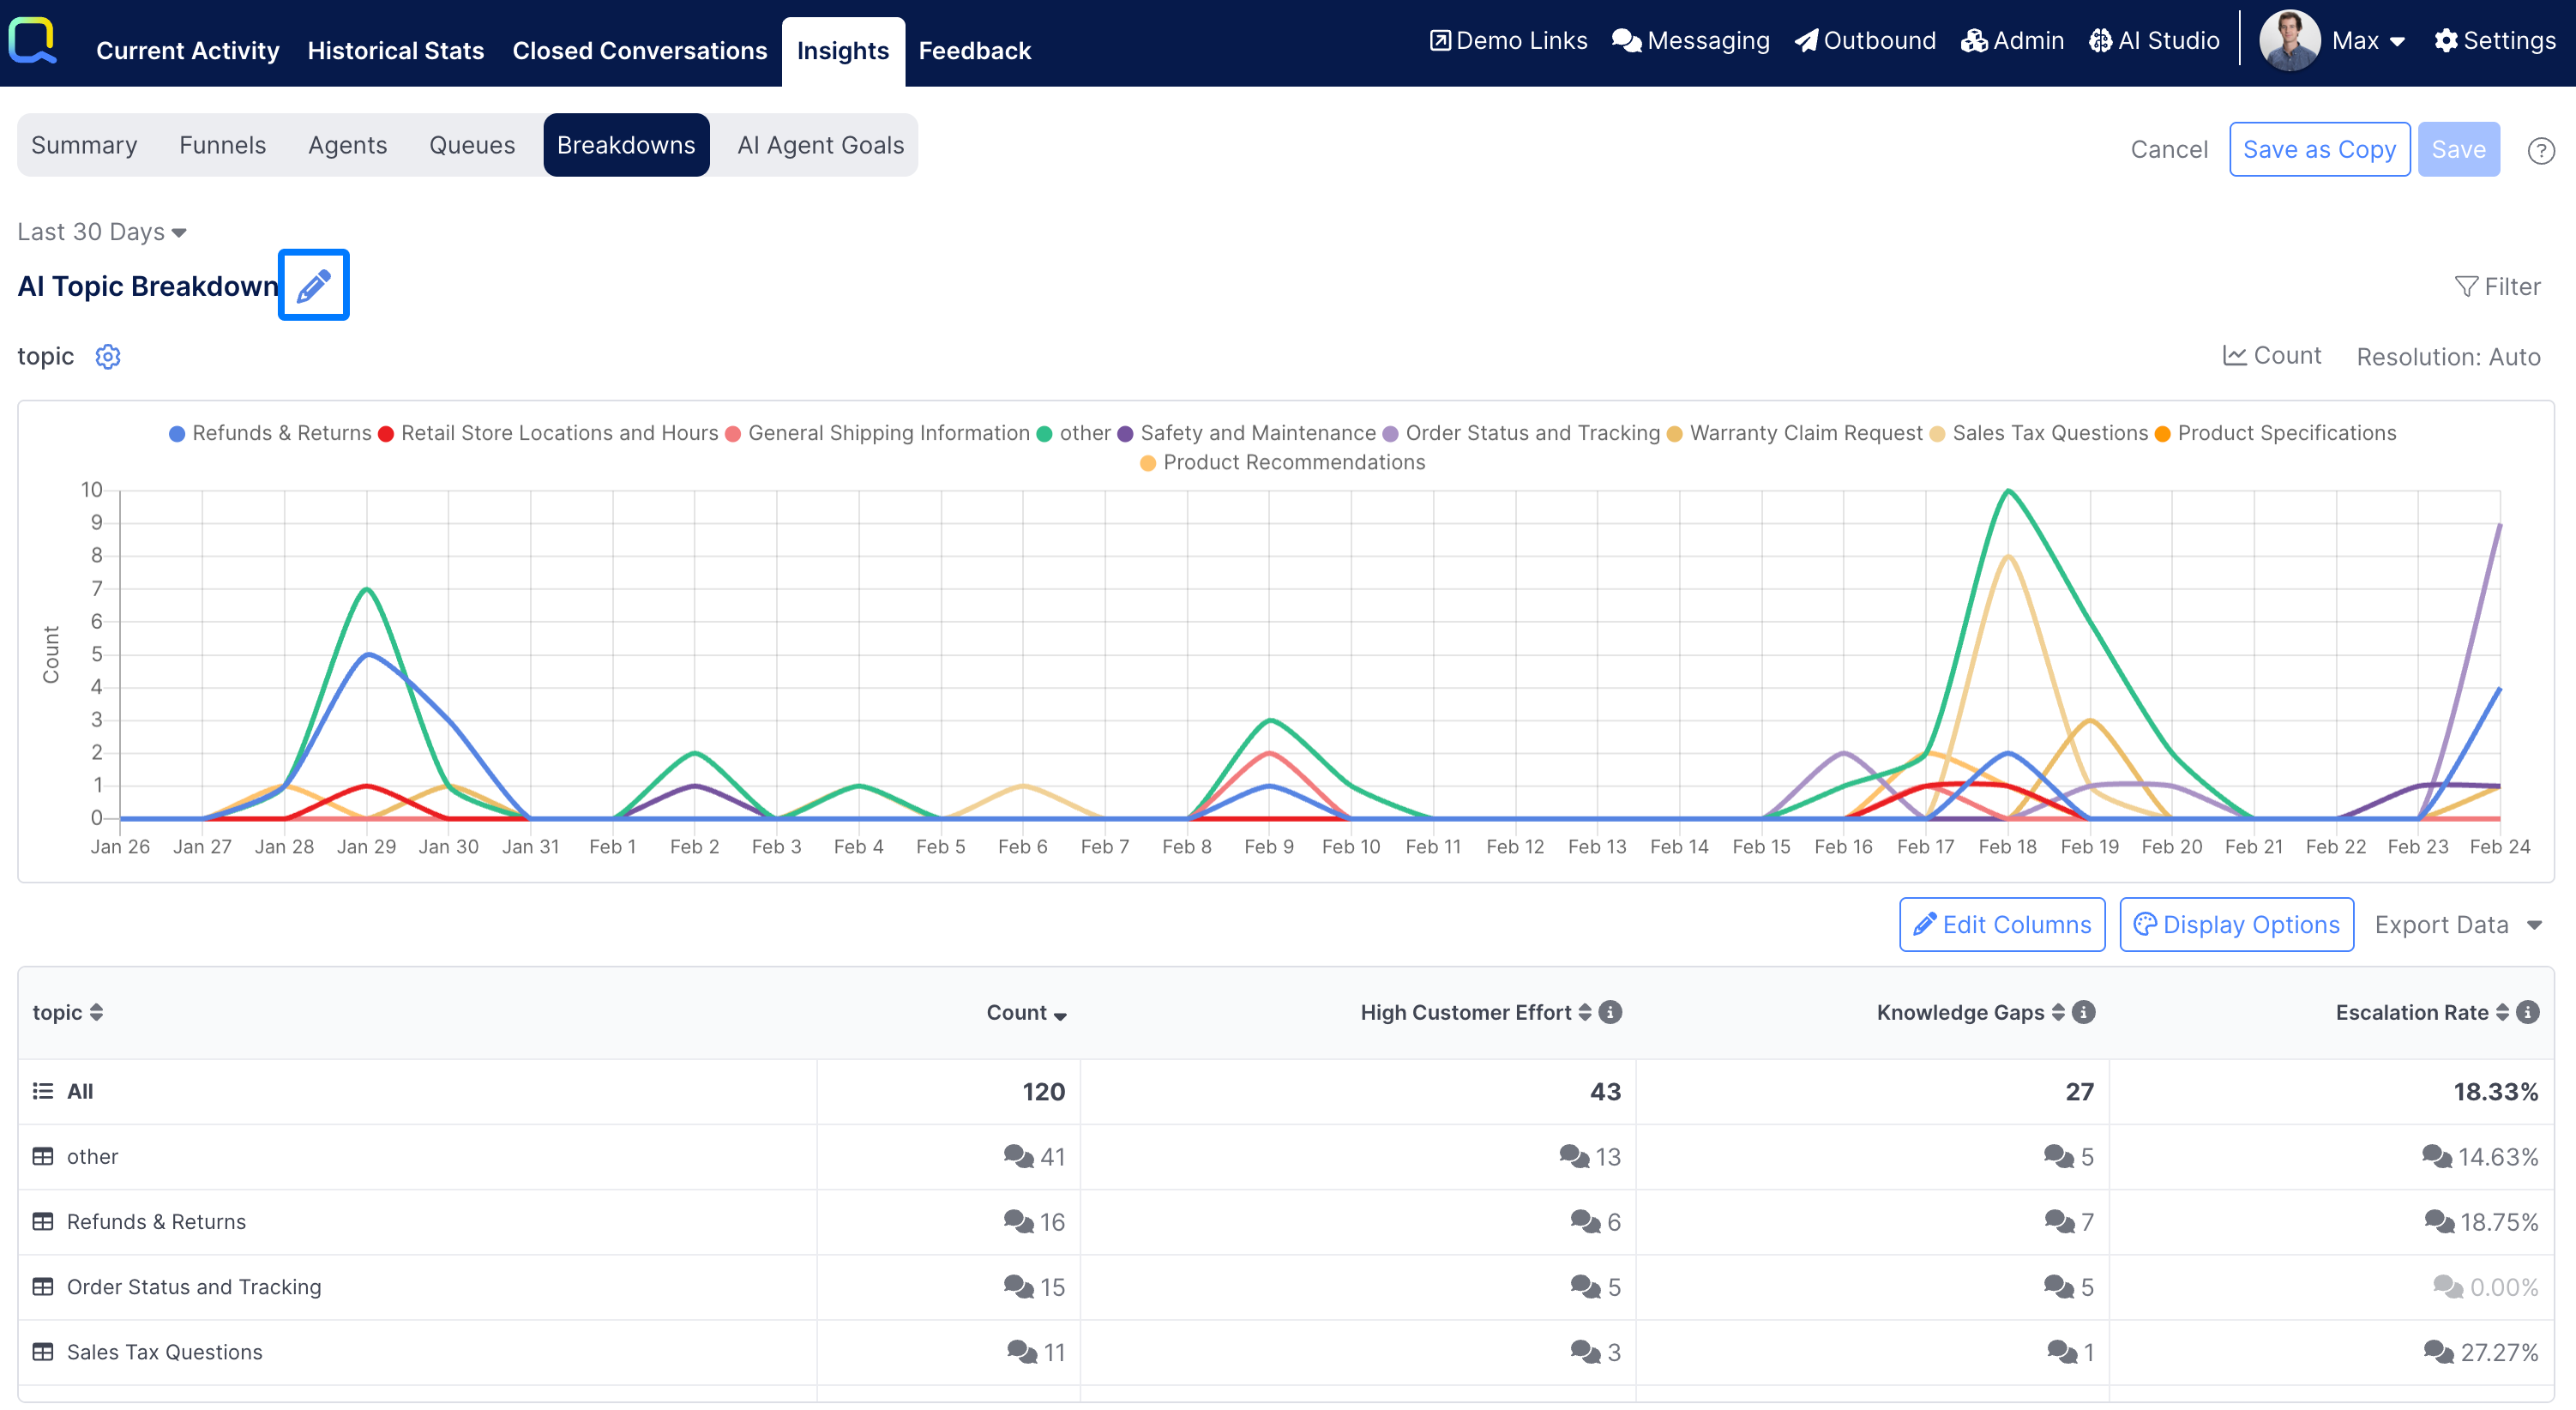
Every new report should have a unique Label. This is what will display in the list of available reports in the Breakdowns tab. By default, a new report will have the label New Breakdown Report. Click the pencil button next to the label to open the Edit dialog and change the label and the report permissions.
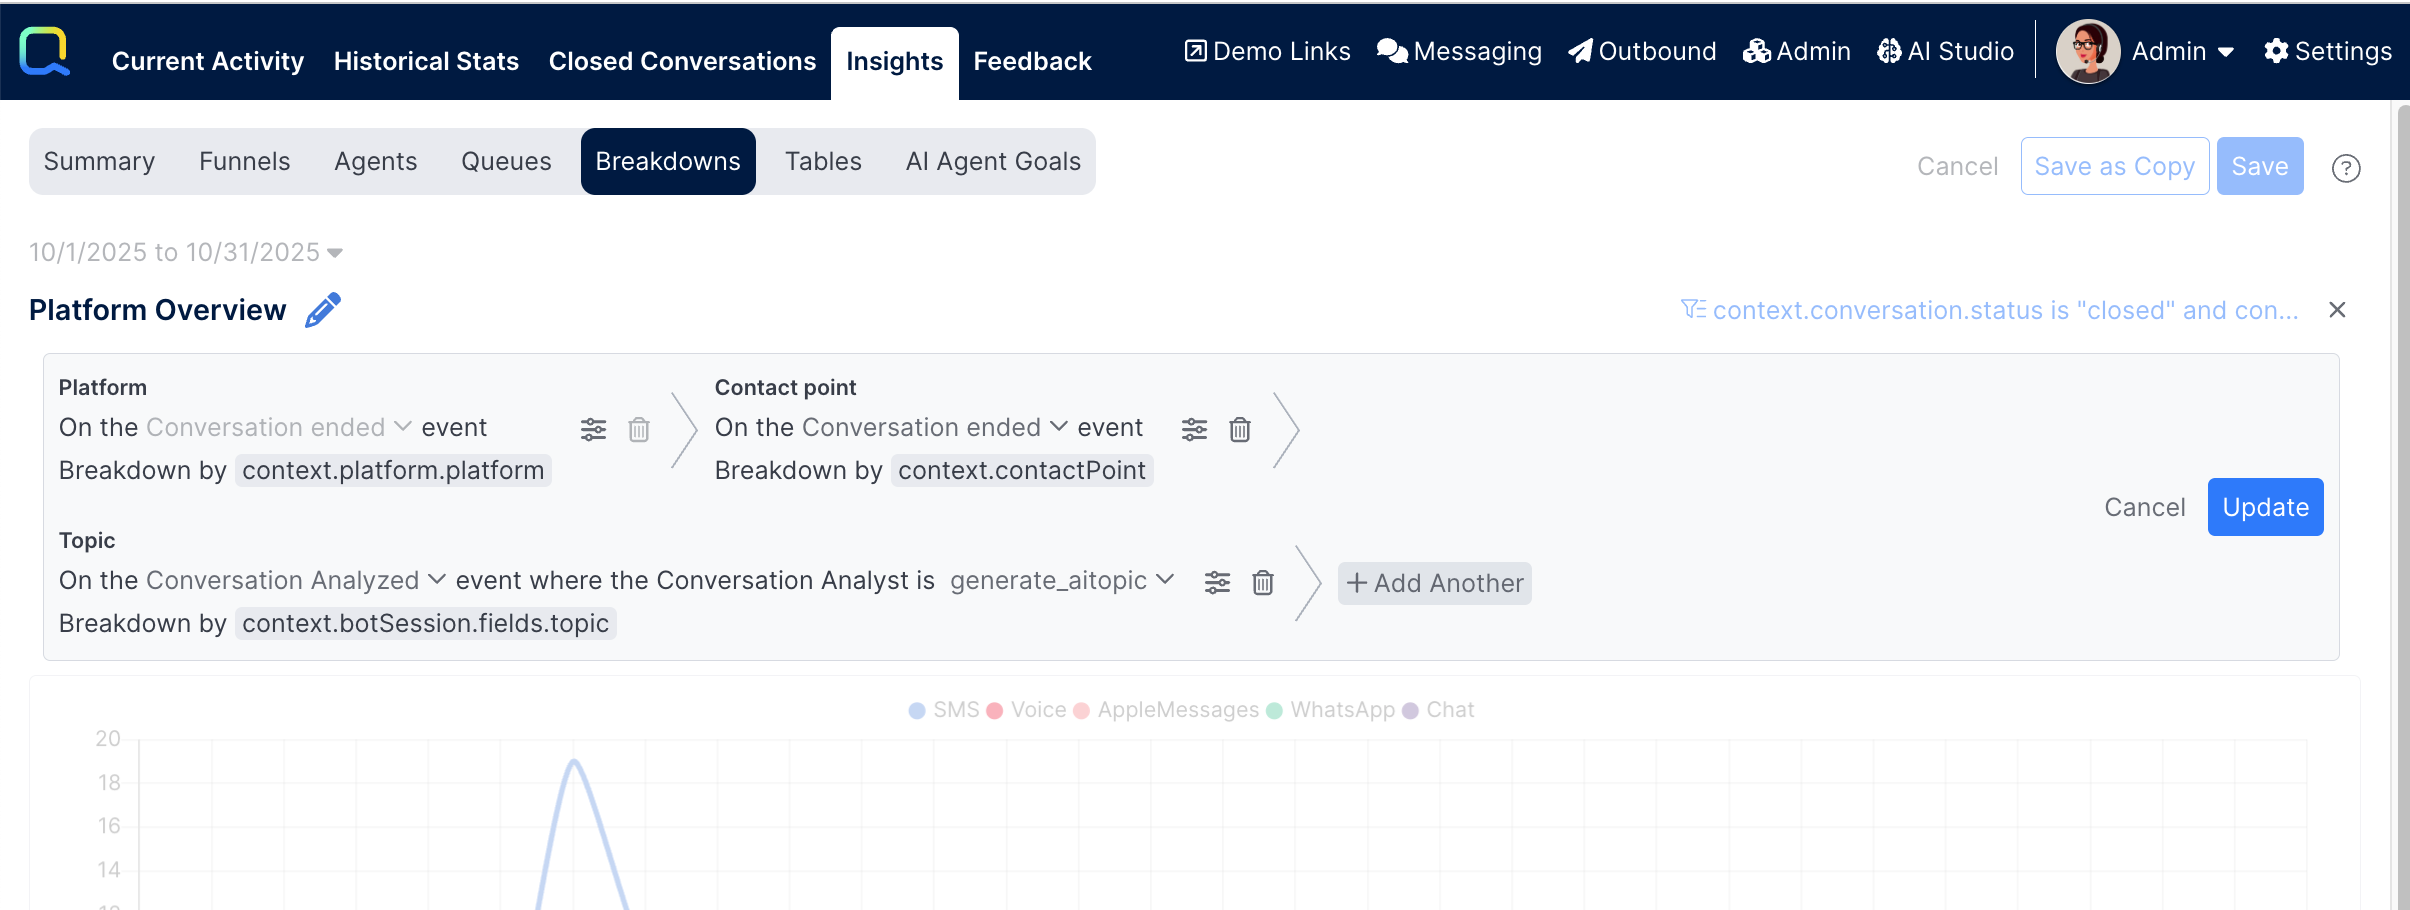
Additionally, at least one Breakdown by field needs to be configured. The breakdown field will be the piece of information you want to view the data broken down by. The Breakdown consists of specifying:
- A Label for that field to be used to reference the field - in most cases this will be automatically set based on the selected field, but can be changed as desired.
- The Event that contains the field of information. This can be:
- Conversation ended - how the field was set at the end of the conversation
- Conversations analyzed - how the field was set by a Conversation Analyst run on the conversation
- AI Agent User Turn - how the field existed with the flow of an AI Agent
- any configured Custom Event that is analytics visible
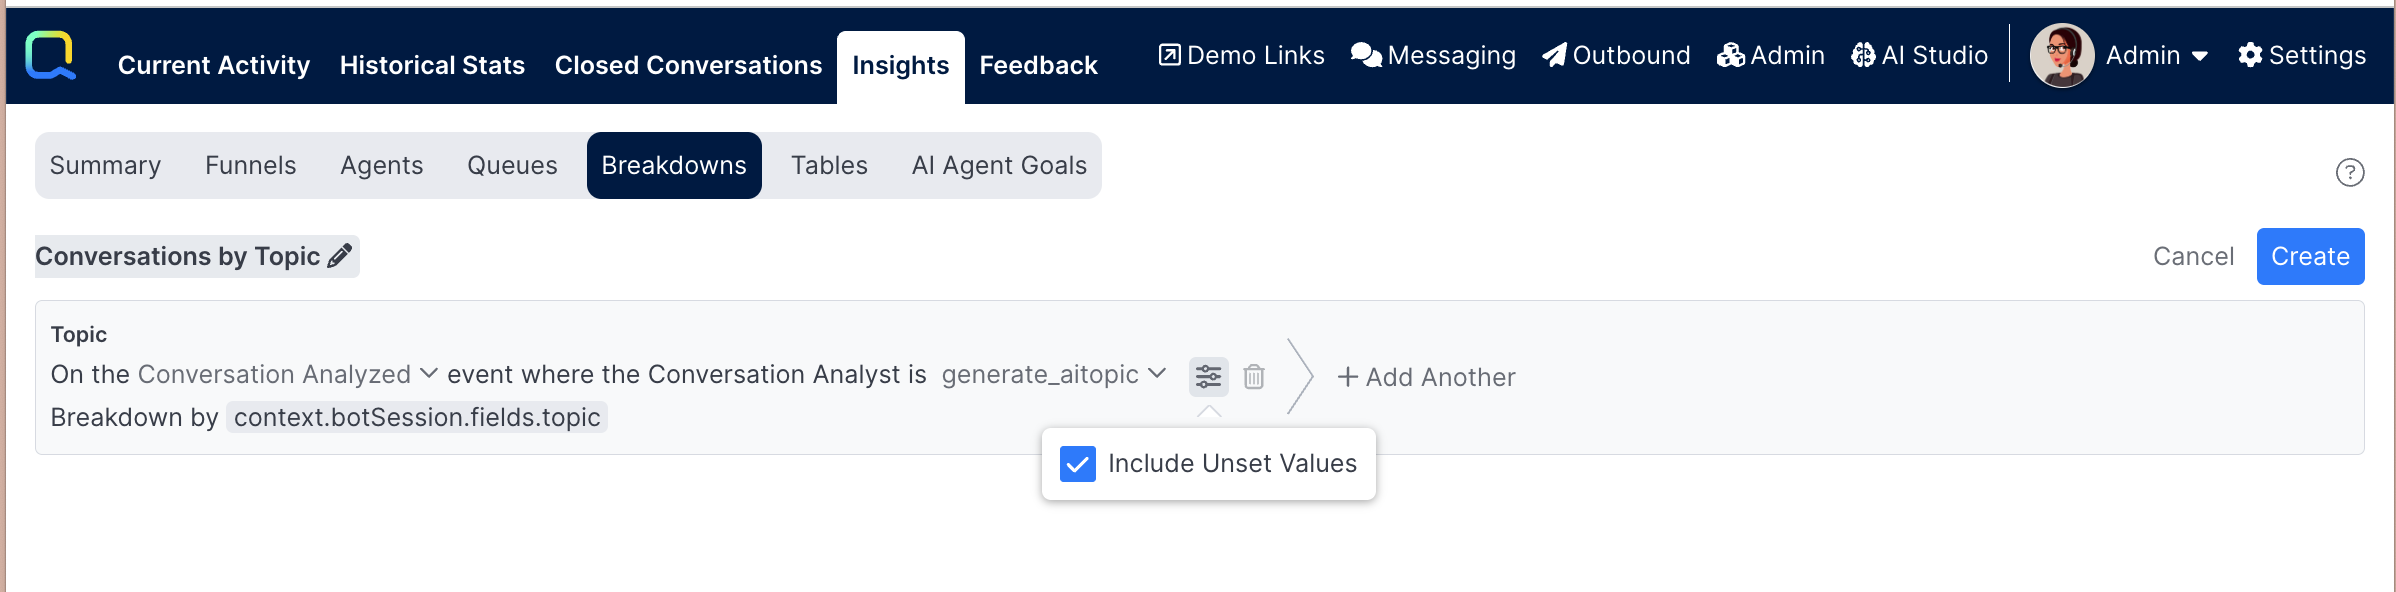
- The Field in that event to show the breakdown by
- Additional settings with an option to Include Unset Values - when selected the data where the fields wasn't set to any value will be included. For example, if the box is checked on a breakdown by a topic field, then those conversations that didn't have a topic set will be included with an Unset value.
Up to 4 additional breakdown fields can be added as well to allow the user to drill into different level to breakdown the data further, and further, for each selected field. Additional breakdowns can be added and changed after the report is created. The initial top level breakdown cannot be edited once the report is created.
After clicking the Create button a new report will be created and opened.
Further Report Configurations
After a report is created additional configurations can be made to expand upon to provide additional details to the user. This includes:
- Edit Report: Allows the admin to change the name or set permission levels on the report
- Filter: Allows all the data in the report to be restricted based on some set of parameters
- Edit Breakdowns: The gear button allows for configuring additional breakdown fields for drilldown levels
- Edit Columns: Allows for additional columns to be added/changed to provide more detailed information
- Edit Columns: Configure specific options about the way data is displayed
Edit Report
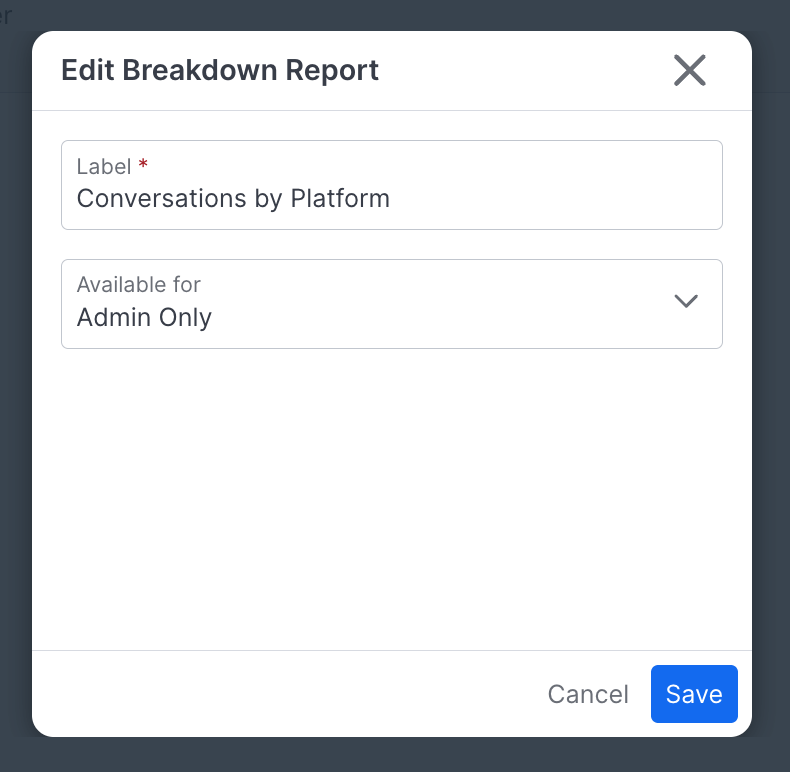
Select the pencil icon to edit the report general settings:
An Admin can manage the following:

1. Label: Change the label name of the Report
2. Available for: Grant viewer permission to sets of Users.
- Admin users will always see all Reports.
- Staff Admin users and Managers will only see the Report if it is marked as Available for Admin and Staff Admin or Admin, Staff Admin, and Manager.
3. If the Restrict Viewership by Role toggle is disabled, all users for the selected permission set will see the Report. If the toggle is enabled, then a non-admin user must be a member of one of the selected routing roles in order to have access to the Report.
Filters
Additional filtering may be done in order to only count data meeting specific criteria in any part of the report. Filters apply to all column metrics in all report breakdown levels.
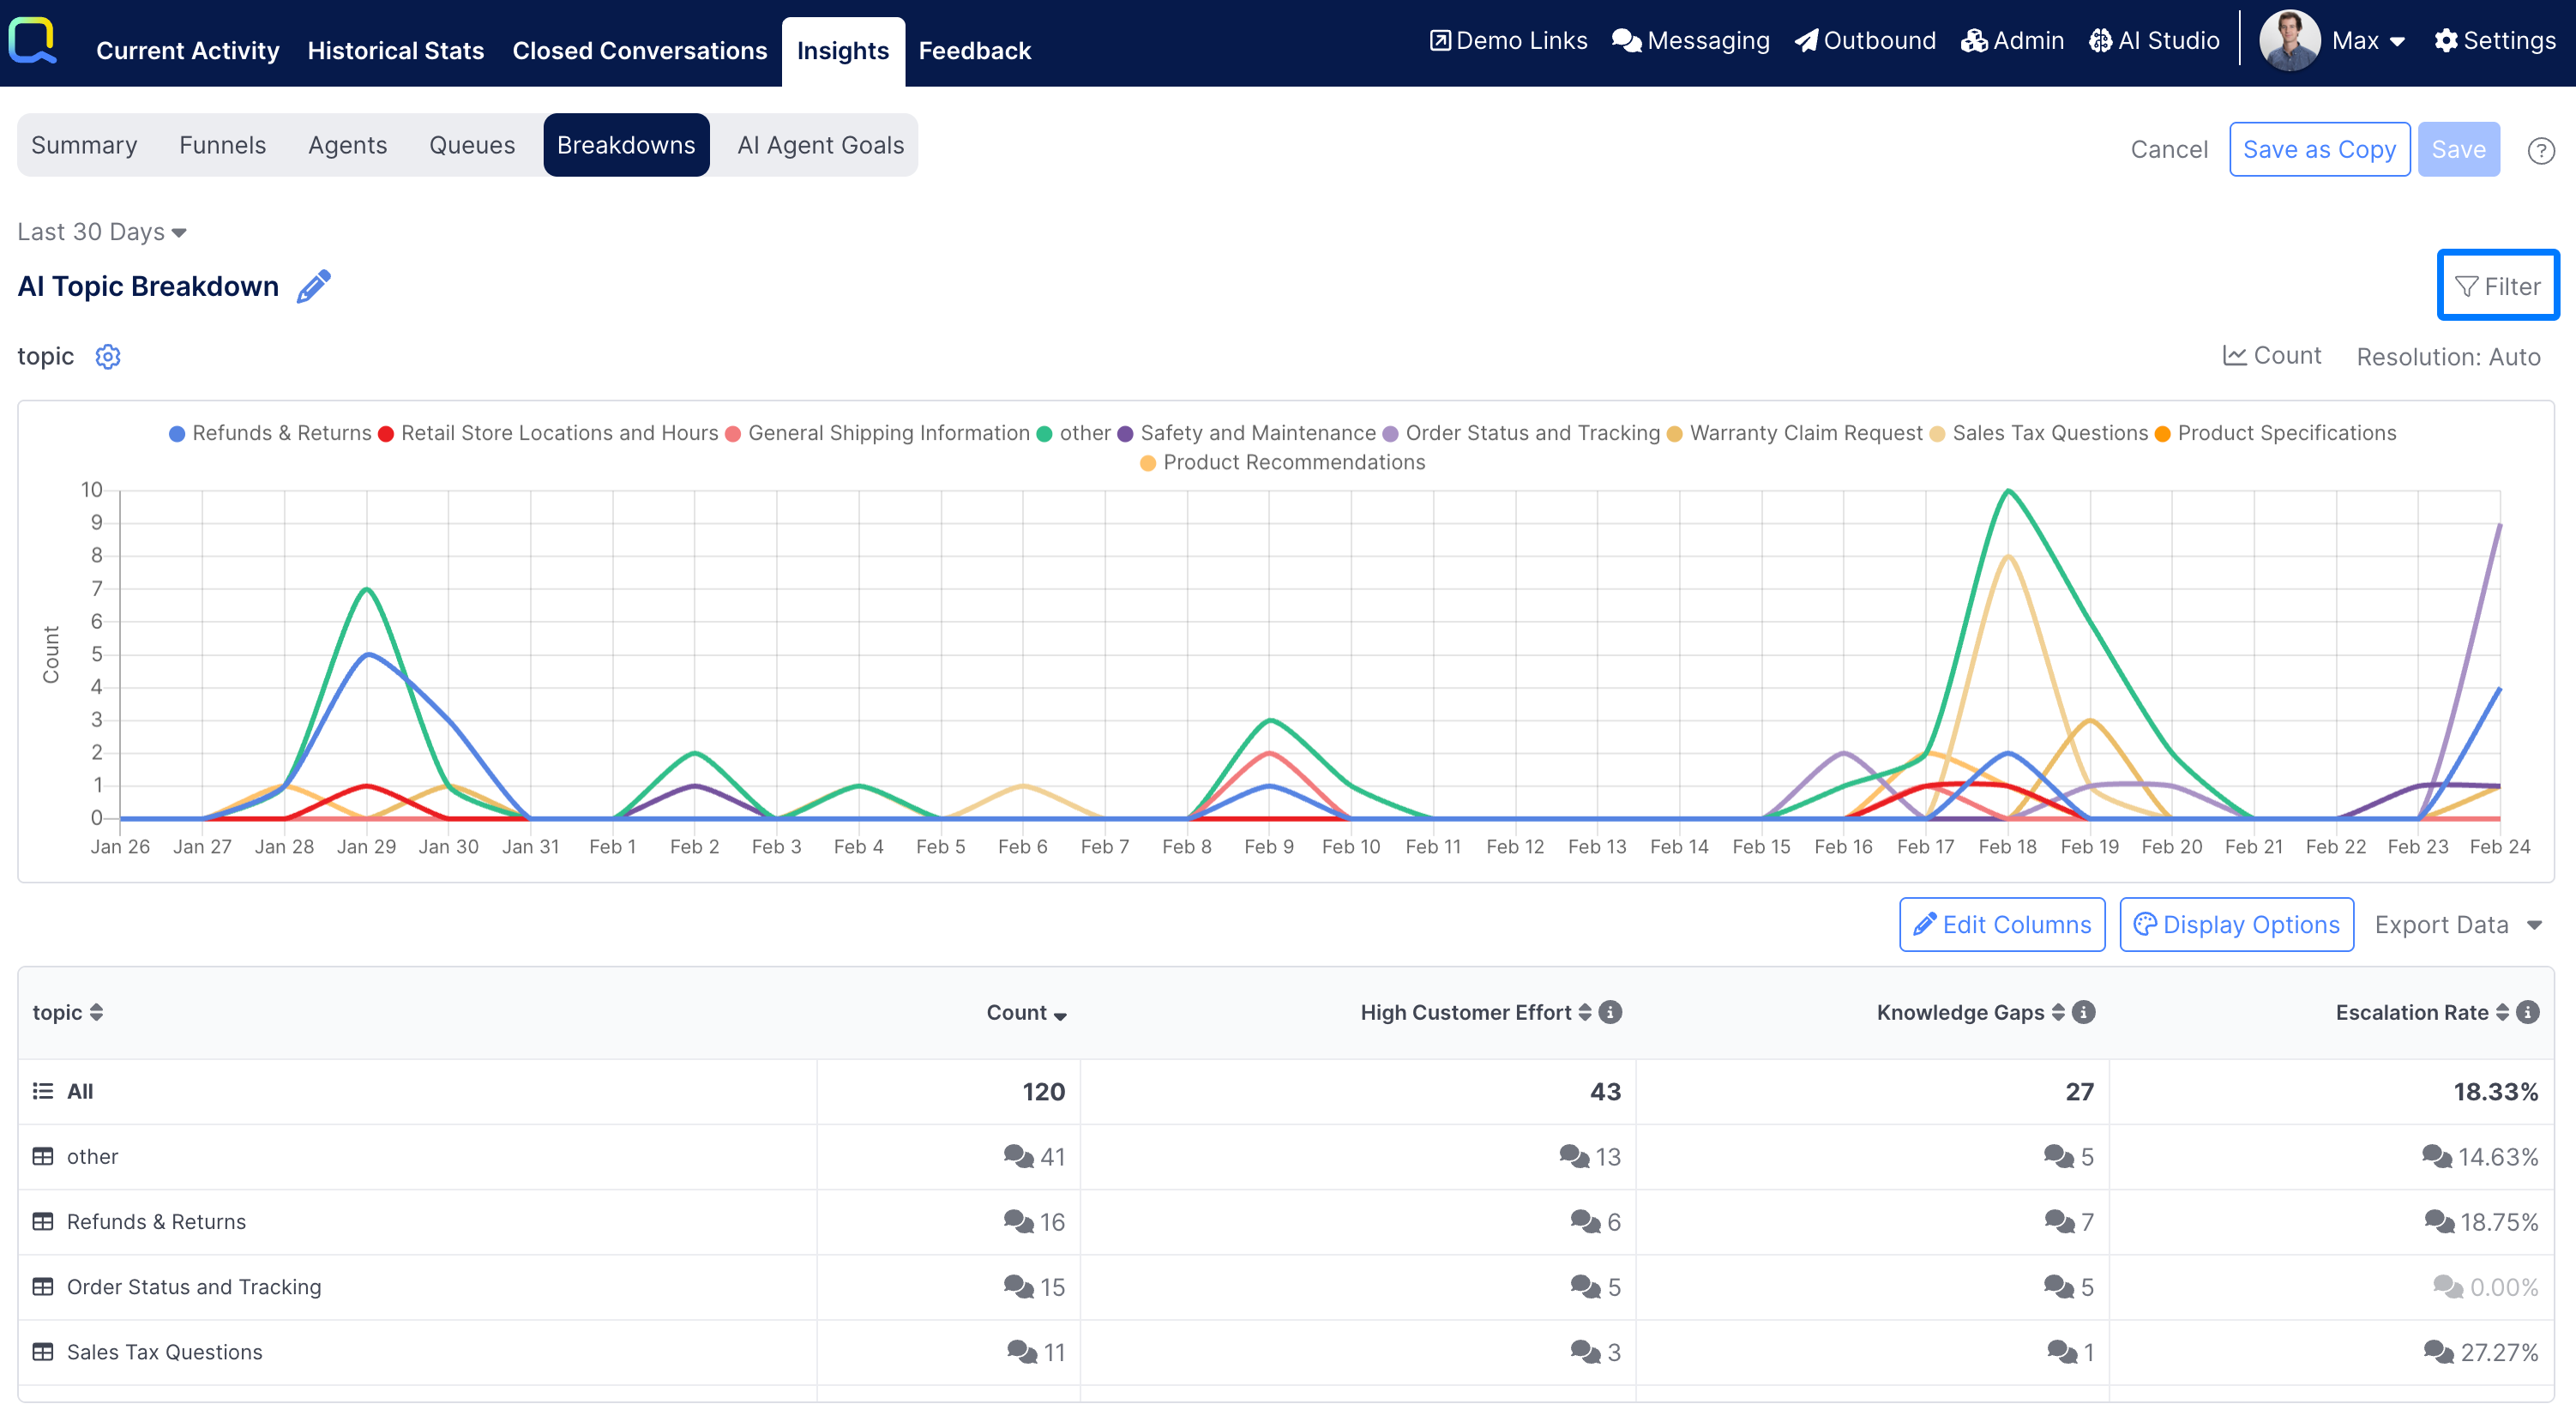
To configure a filter(s), select the Filter button in the upper right corner.
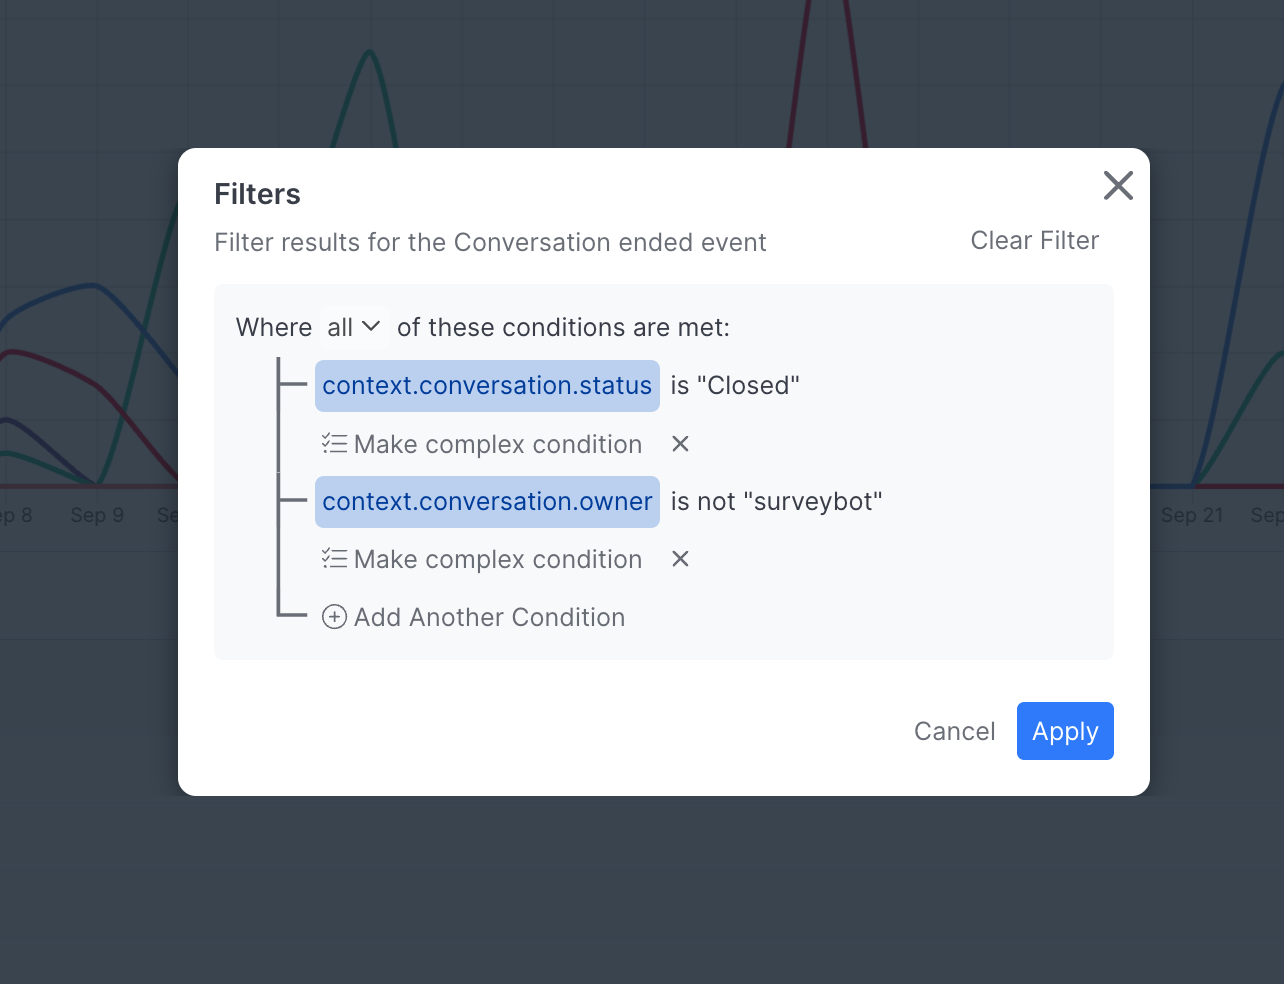
A set of filters can be defined by adding conditional criteria much the same way it works in the AI Studio designer and in Conversation Rules. The filter will need to be set on some field in the filter event that was selected when the report was created, and an operator will need to be selected. Depending on the operator, a comparison value may need to be entered as well.
Complex conditions can be configured to ensure that multiple pieces of criteria are met.
For example, the admin may want to only look at conversations that were Closed (not those that were marked as Spam or Abandoned), or they may want to include only non-survey conversations.
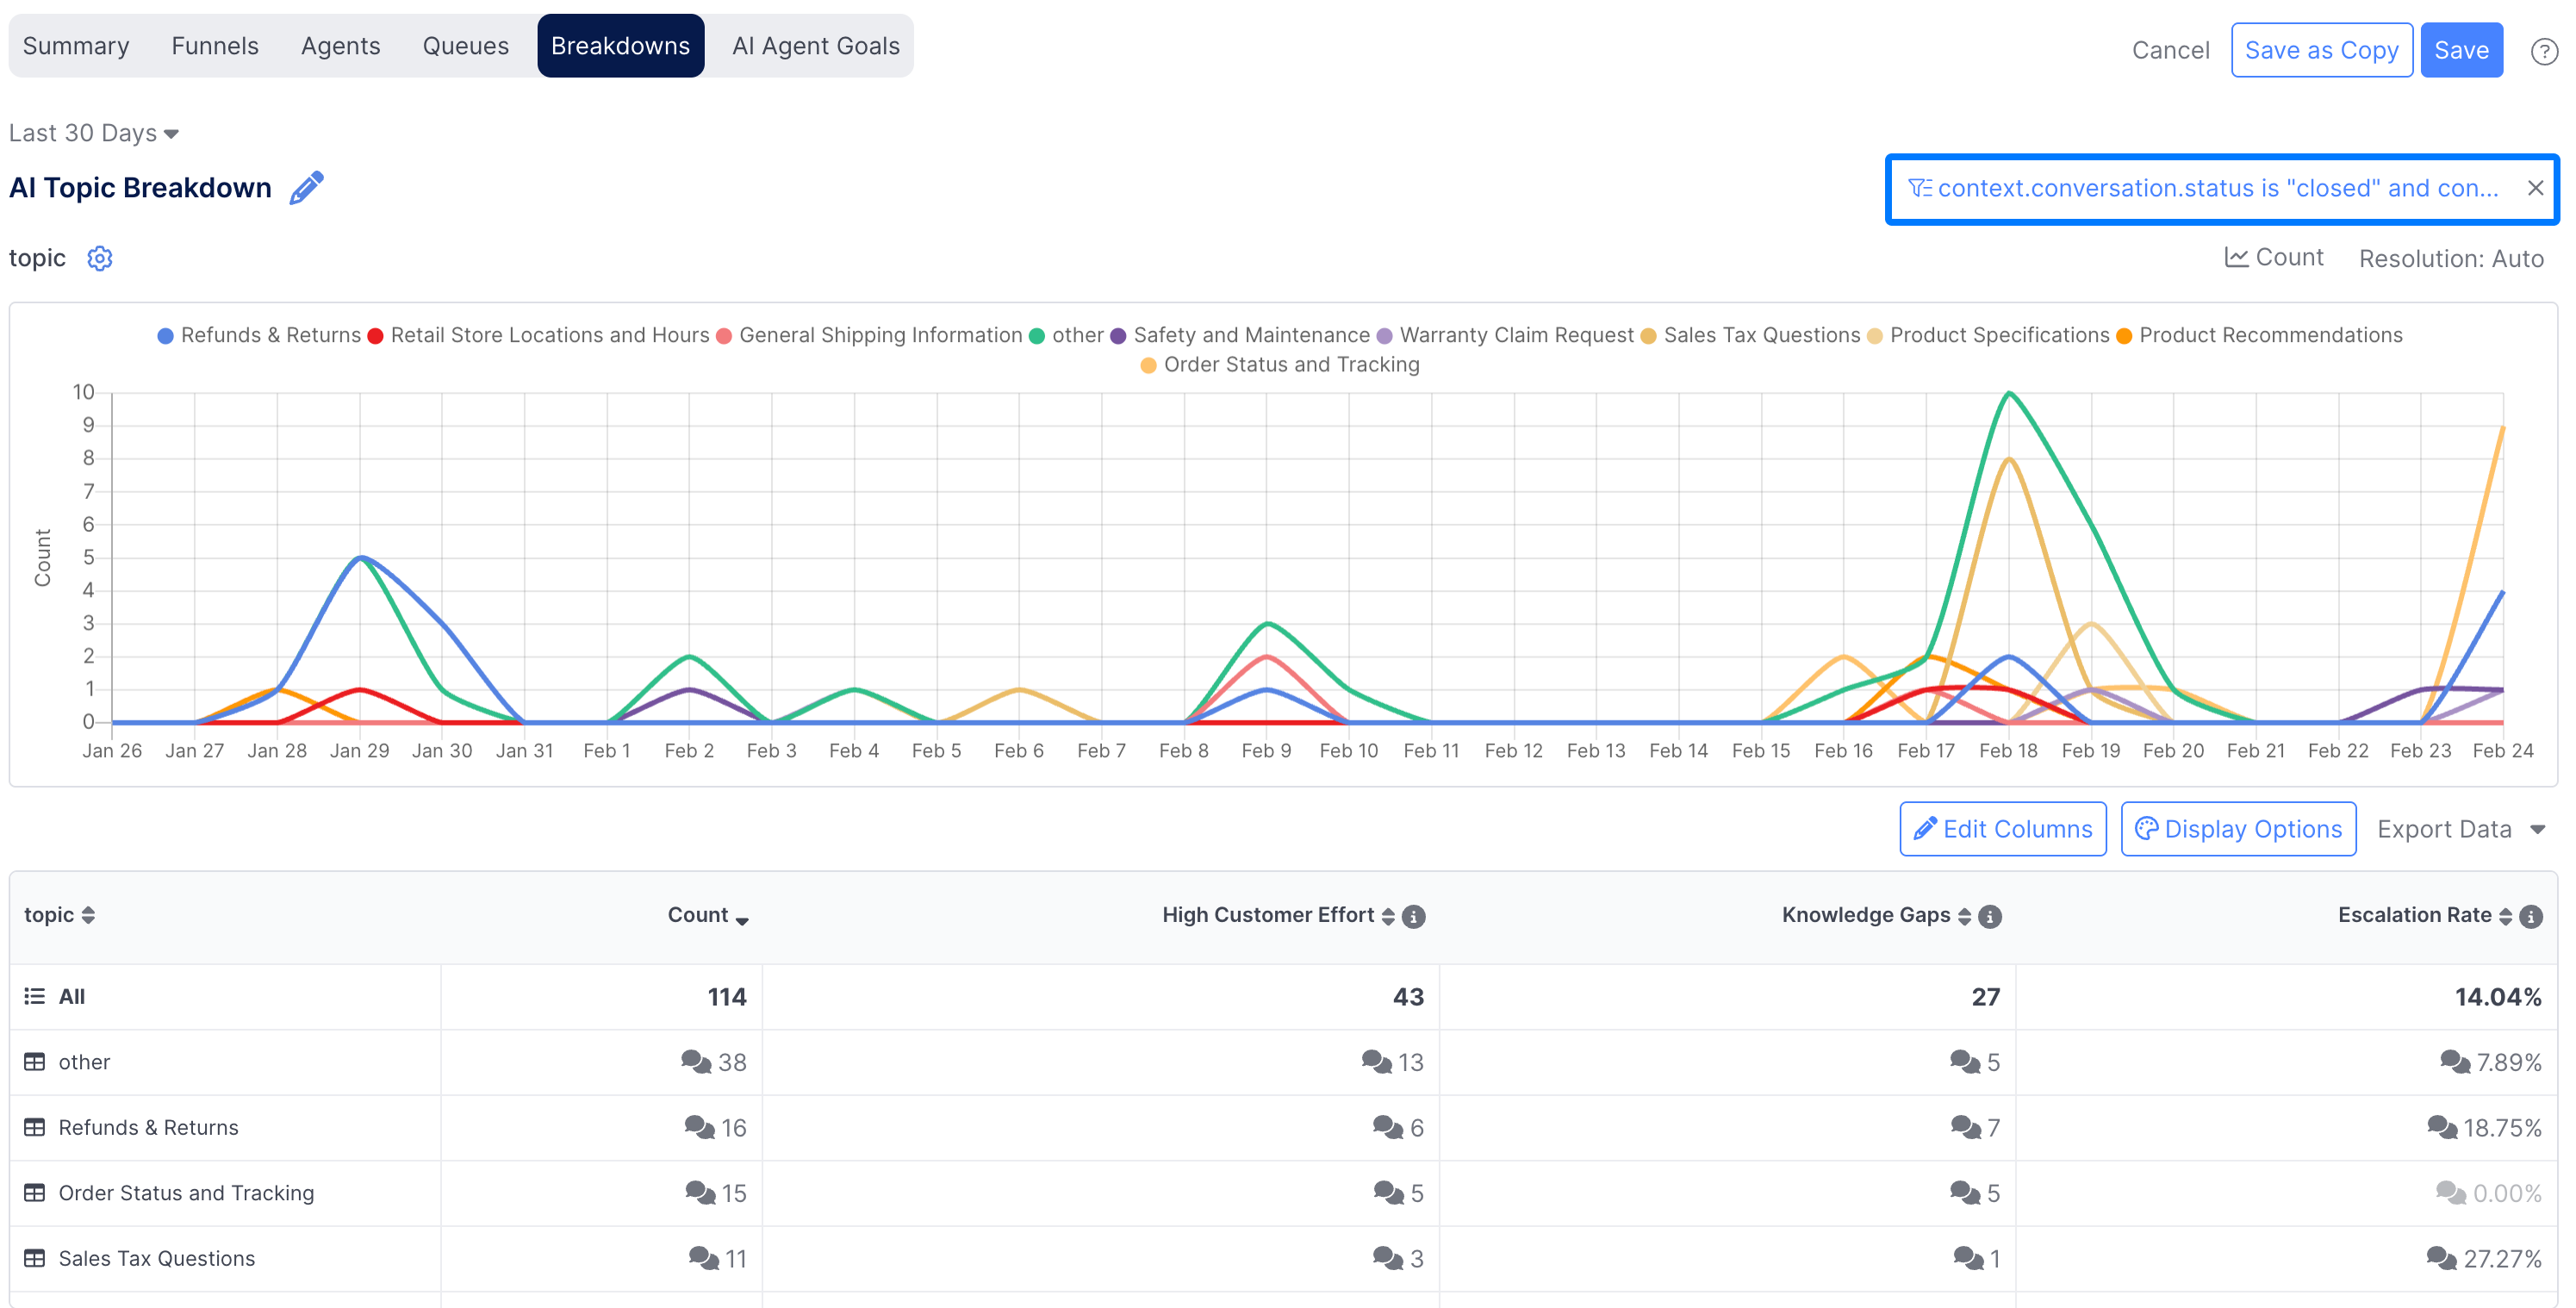
Once Apply is selected, the defined filters are applied. The filter(s) that was configured displays as the button text to alert the user the data is being restricted. When the Report is saved with filters, those filters will be applied when the report is opened later. The button can be selected to Clear or change the filters by an admin user.
Breakdowns
The gear button below the report label can be selected to define new, or view existing breakdowns that have been configured.
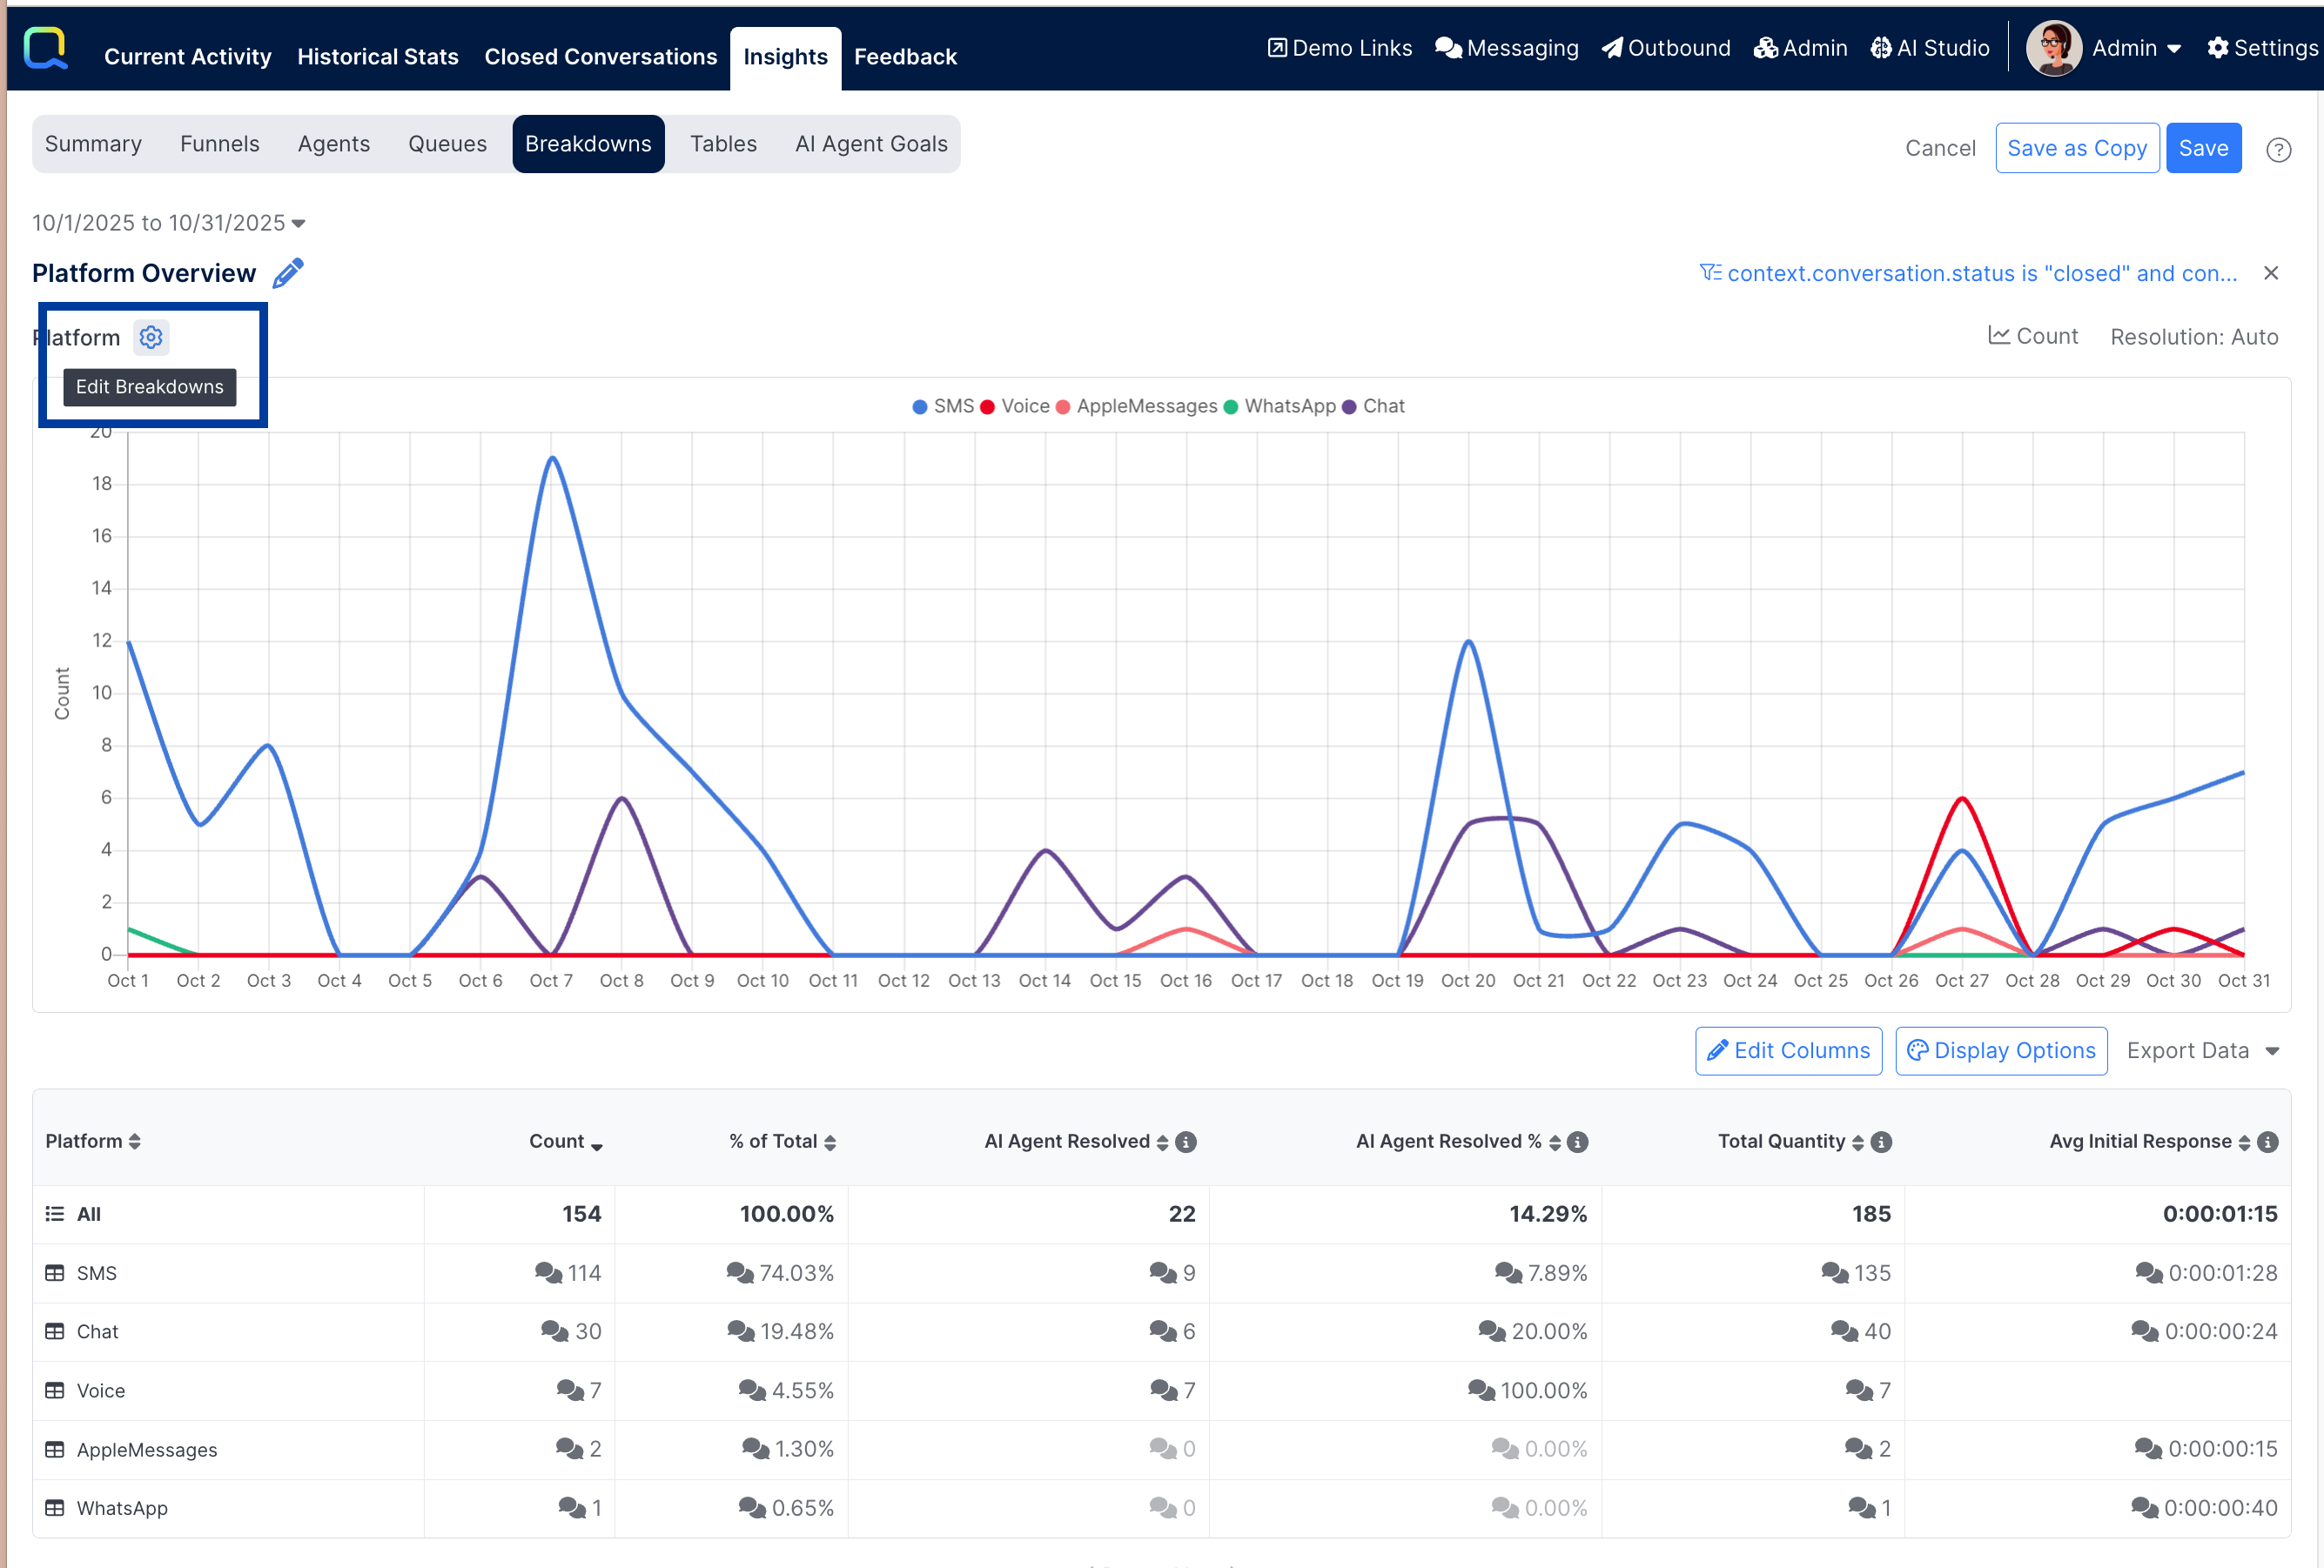
A breakdown is created by specifying another field. This allows the report data to be broken down by this, then by that, then by this other. Adding a breakdown is much like adding a drilldown level showing metrics grouped on another field. Each report can have up to 5 breakdown levels.
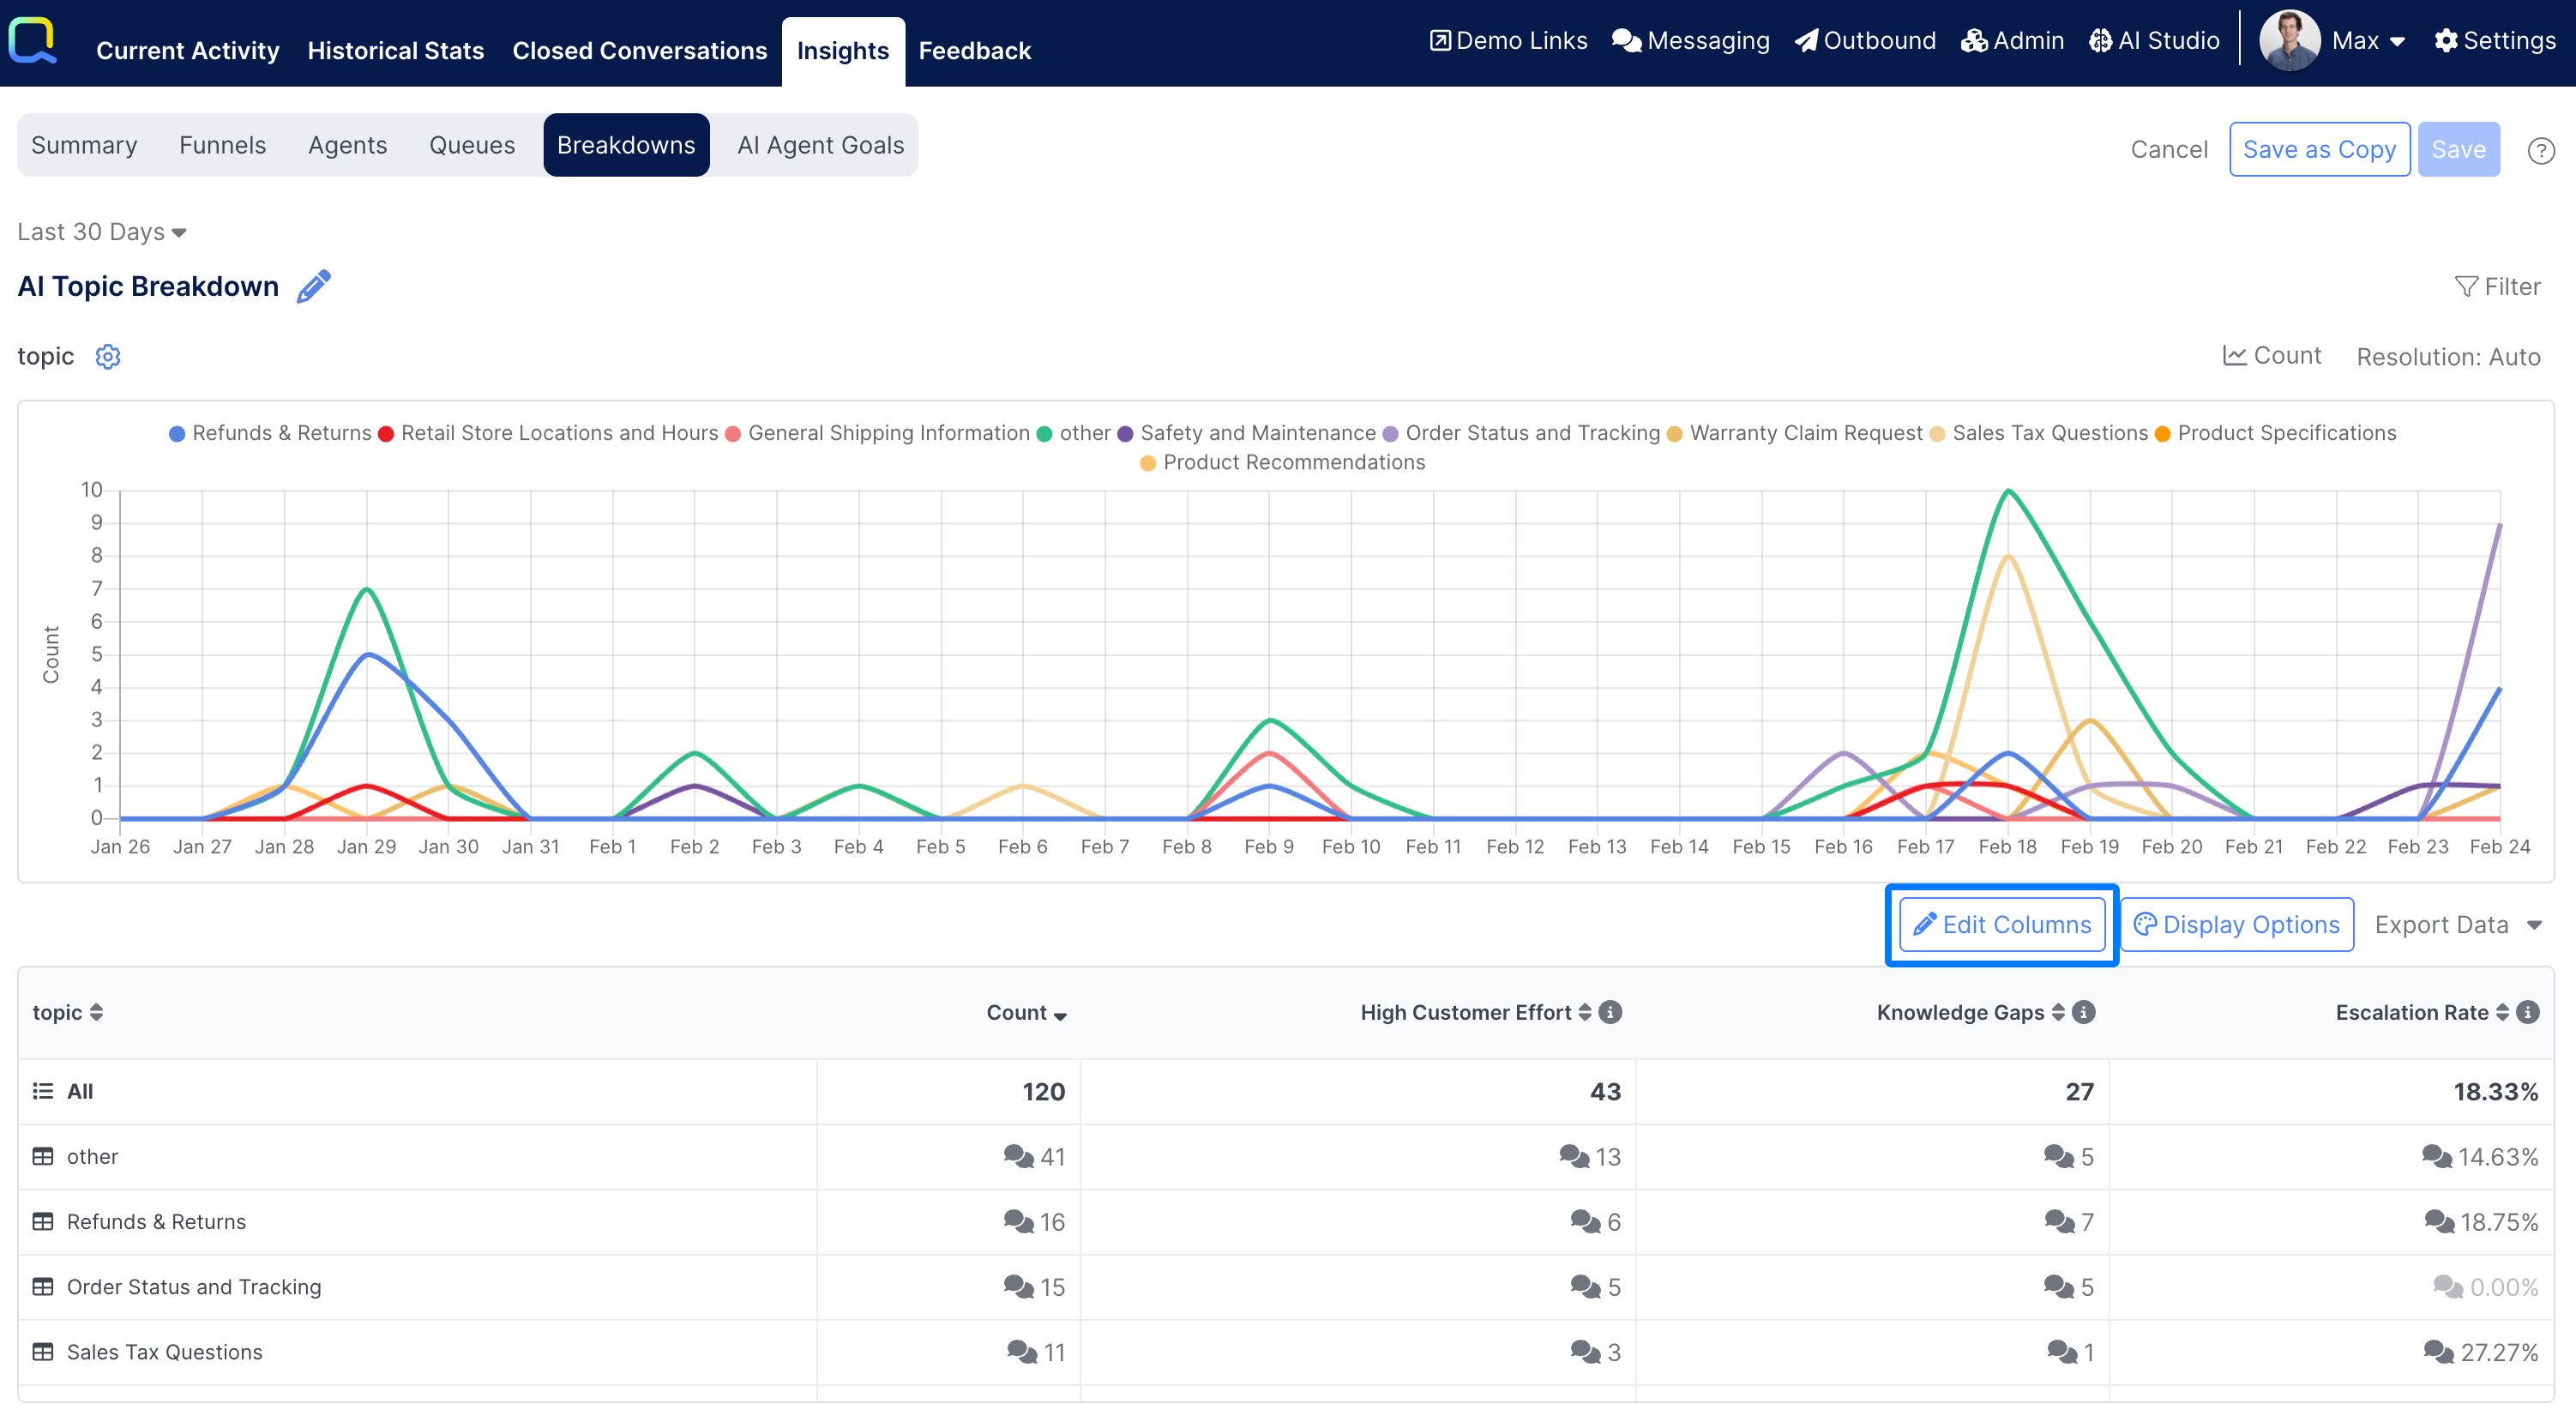
Edit Columns
The Edit Columns button in the upper right of the table display can be selected to define new, or view existing columns that have been configured for the report:
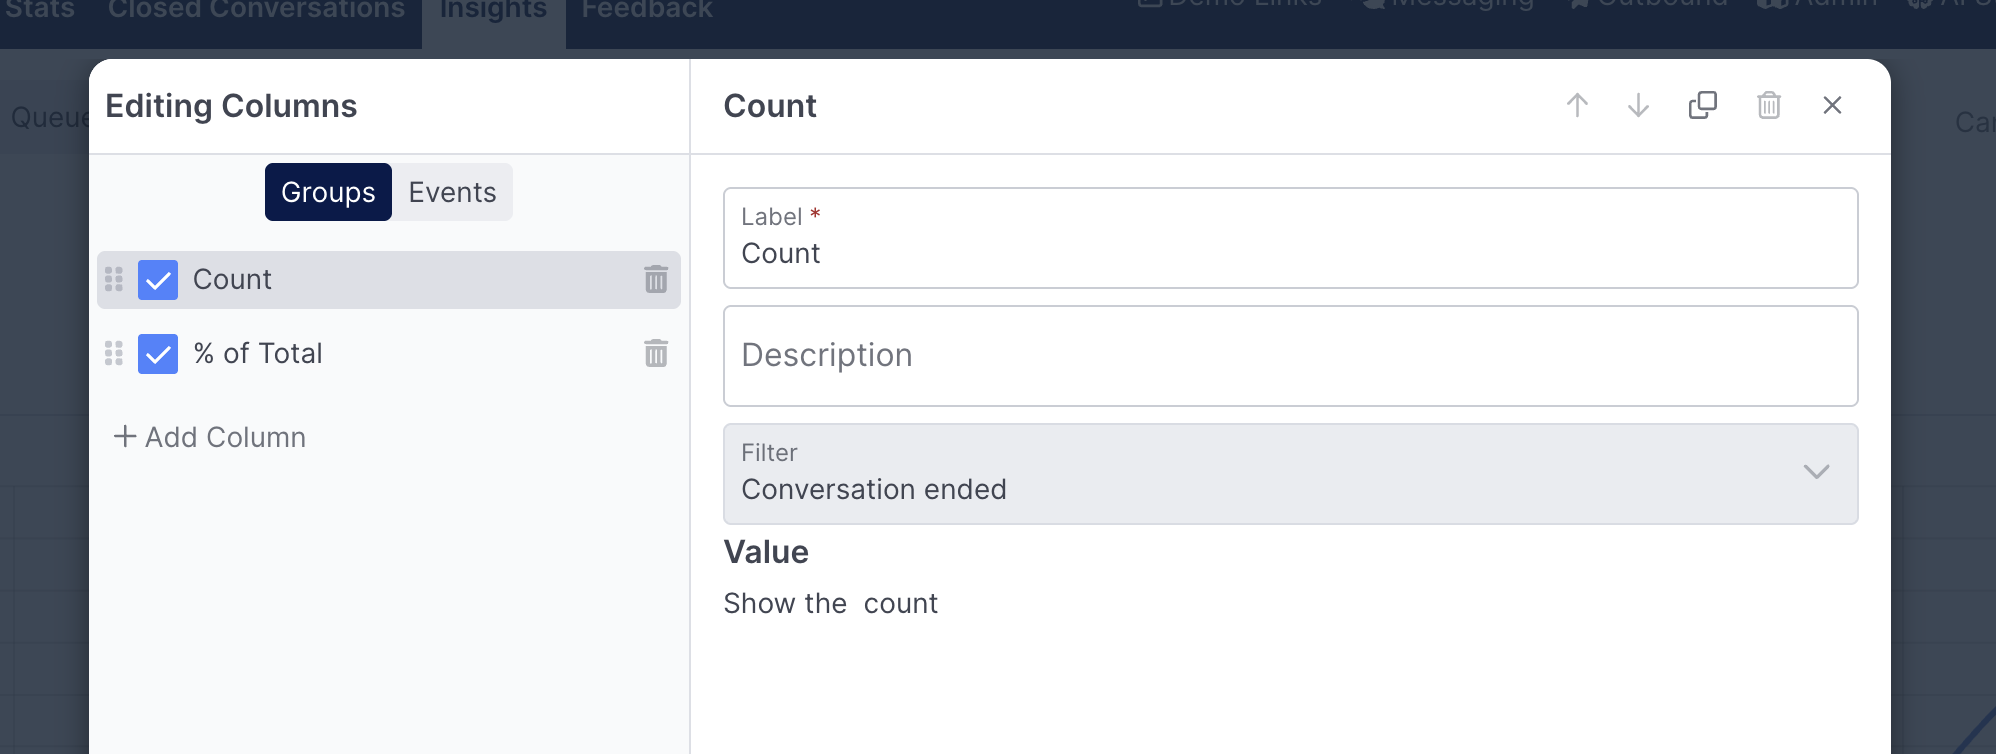
The Edit Columns modal contains two tabs — Groups and Events — allowing columns for both the breakdown table and the event list to be configured from either level without needing to navigate between them:
Groups Tab
By default, two columns are displayed:
- Count: Displays the total number of events that occurred in each breakdown category, that match the configured filters.
- % of Total: Displays percent of events that occurred in each breakdown category, compared to the total for all categories.
Additional columns can be configured by selecting the + Add Column button at the end of the list of configured columns.
Each column is configured with the following:
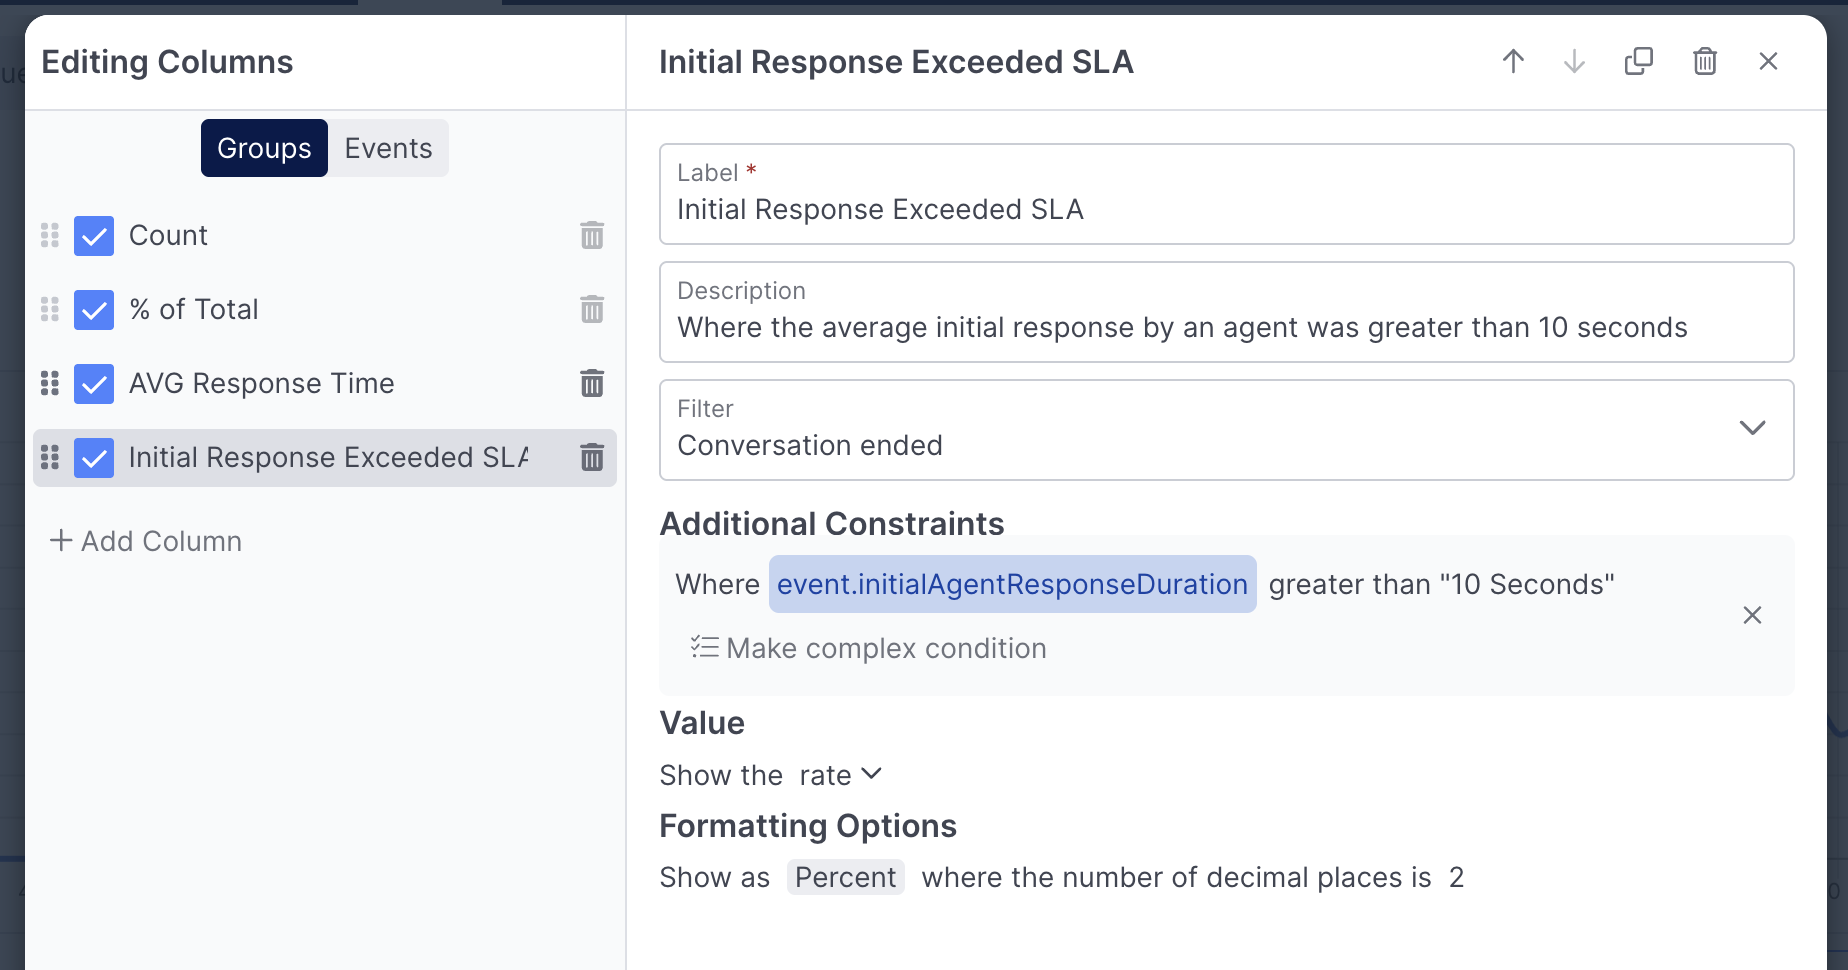
A sample column tracking the rate at which the initial response duration exceeded 10 seconds.
- Label: The column heading that appears in the table, and the name of the metric that can be selected in the chart. Label is required and should be unique for each column in the report.
- Description: The description of the information in the column metric that appears as a column tooltip. The Descriptions is optional and can be left blank.
- Additional Constraints: Additional constraints are conditions to define the subset of criteria that should be applied only to this specific metric. It can be left blank. Normally, it will be set for additional Count or Rate columns.
- Value: The selected calculation to apply on the data. This can be set to:
- Average:: The overall average of some selected number-type field for each breakdown
- Percentile:: The value of some number-type field at the indicated Kth percentile (0-1) for each breakdown
- Count:: The number of events that match the configured column constraints for each breakdown
- Rate:: The proportion, or percent, of the number of events that match the configured column constraints, as compared to the default Count column, for each breakdown
- Sum:: The total of some selected number-type field for each breakdown
- Formatting Options: Control display formatting on the returned metric to specify the number of decimals to return, if the metric should be expressed as a percent, or any duration time unit options.
When adding a new Group column, the default value type will be set to Average, along with a prompt for the property field
Up to 10 column metrics can be configured for each breakdown table
Events Tab
The Events tab displays the columns configured for the Event List view. When columns are added on the Groups tab, a corresponding placeholder column is automatically added to the Events tab as well. Columns on each tab can be edited, hidden, and removed independently without affecting the other:
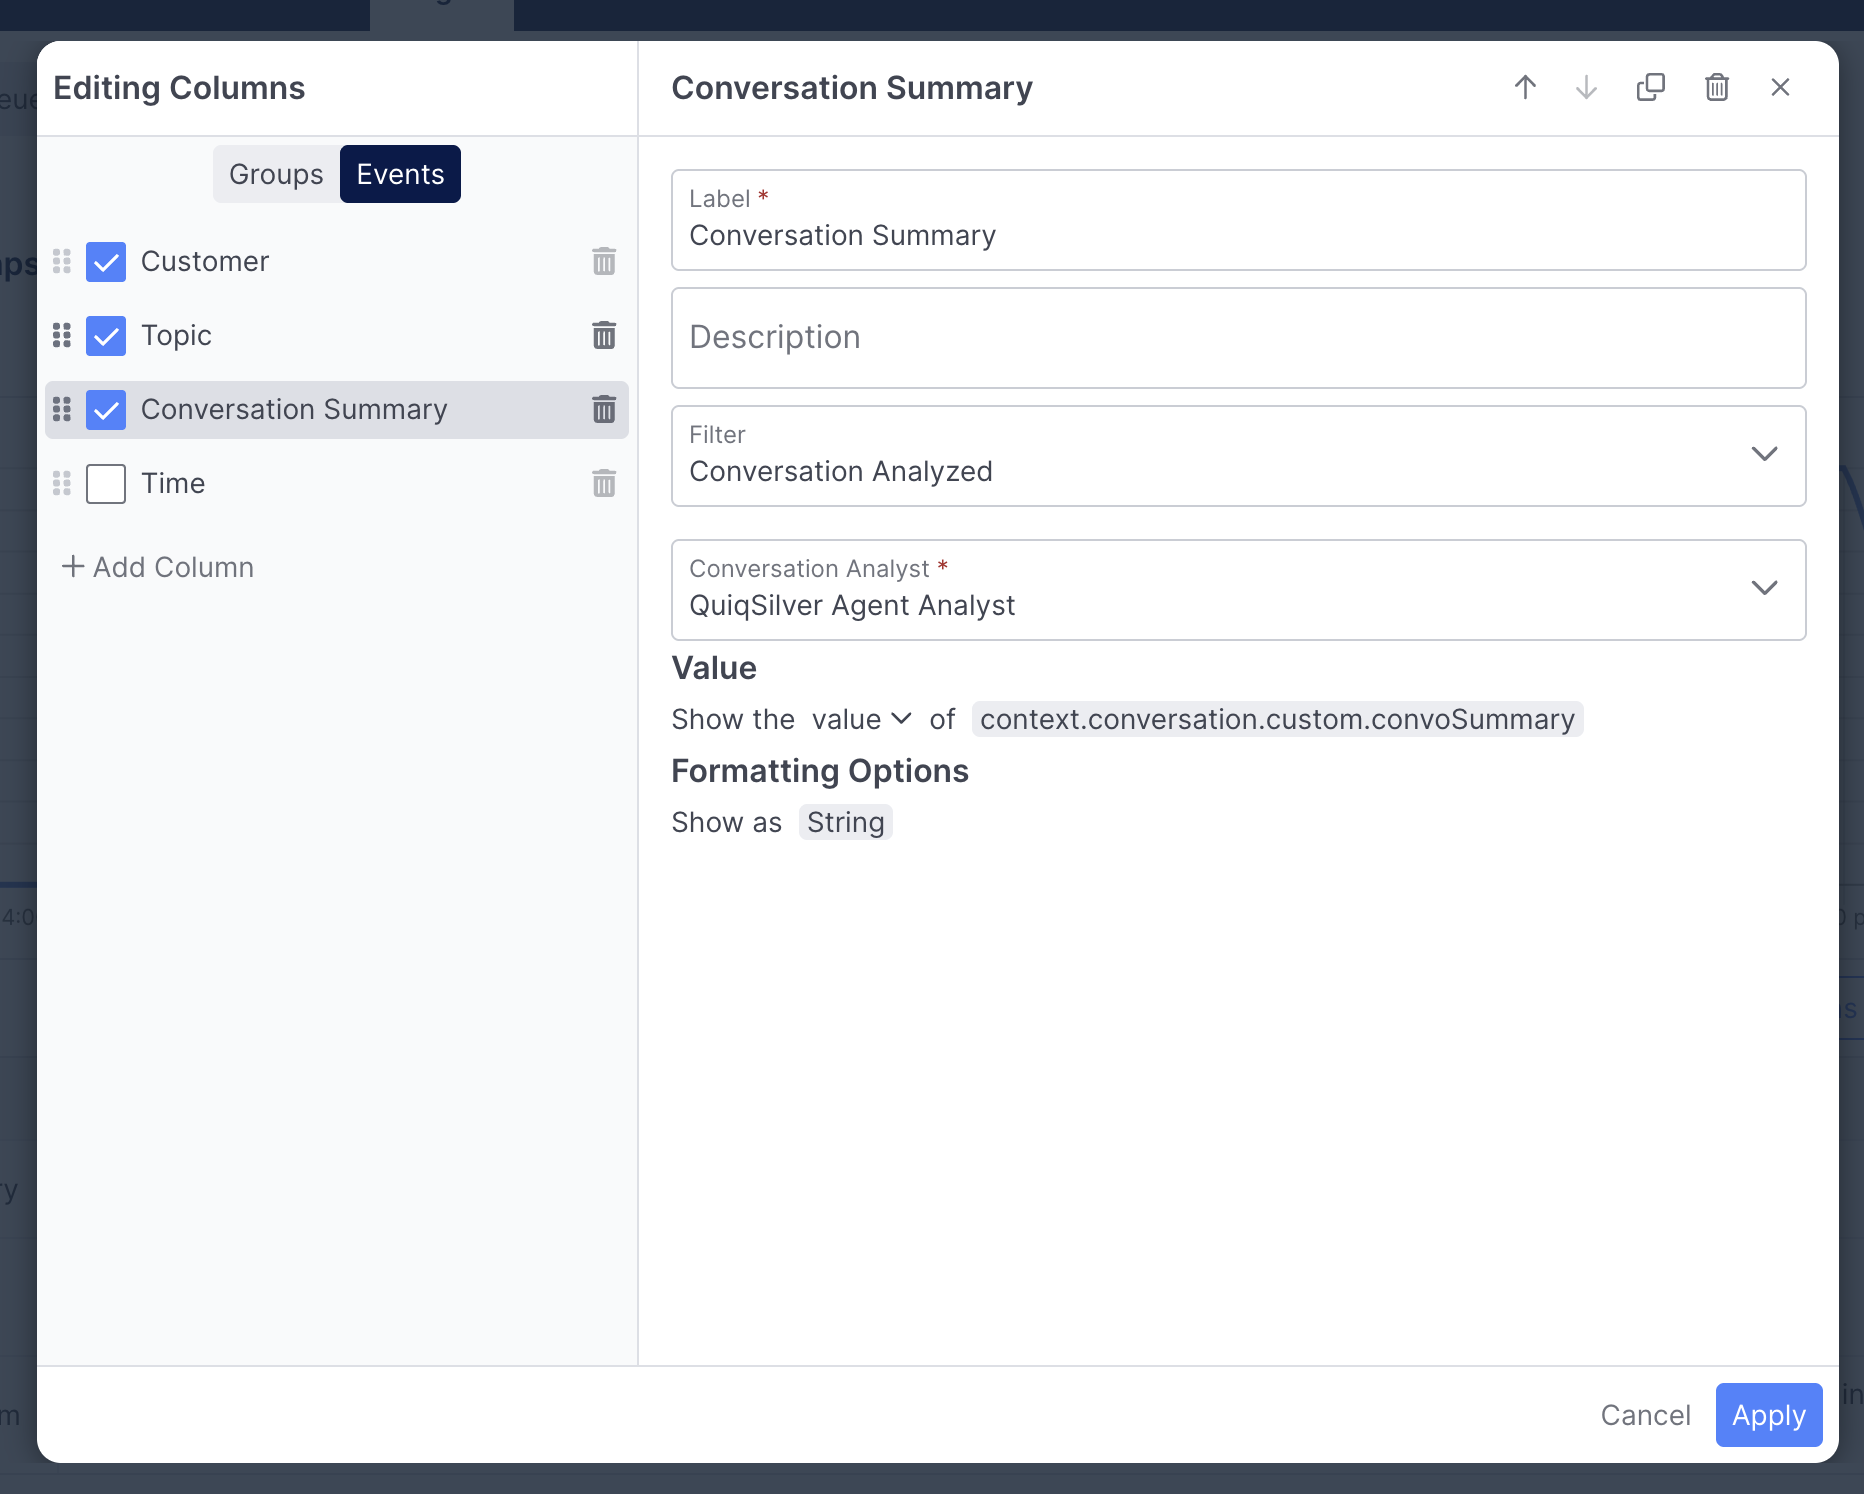
The Customer and Time columns are fixed in the first and last positions respectively — they can be hidden, but cannot be removed or re-ordered. Their labels and descriptions can be changed.
The + New Column button is available when fewer than 16 columns are listed. Two types of columns can be added:
- Count columns return a Yes or No indicator for whether each event matched a set of conditions. These should typically have Additional Constraints configured.
- Value columns display the value of a specified field for each event.
Columns carried over from the Groups tab follow these conventions:
- Columns defined as a Count or Rate on the Groups tab appear as Count columns on the Events tab.
Columns defined as an Average or Sum on the Groups tab appear as Value columns on the Events tab.
These placeholder columns can be re-ordered, hidden, deleted, or edited to change the label or description. The way the column value is defined cannot be changed on a placeholder.
If a placeholder has not been modified and the corresponding Groups column is deleted or renamed, the placeholder will be deleted or renamed to match automatically. Once any changes have been made to a placeholder, it will no longer stay in sync with the Groups column.
Some things worth keeping in mind when reviewing the auto-added placeholder columns:
If both a Count and a Rate column represent the same conditions, one can be deleted since having both is redundant.
Column names can be updated to better reflect the event-level data — for instance, an Average Response Time column at the breakdown level might simply be labeled Response Time in the Event List.
The Event List view can have up to 15 columns configured
Applying Changes
When finished configuring columns, select the Apply button to save changes and return to the report view.
Changes made on either or both tabs will be applied where modifications were made, and the report will refresh to reflect any new, changed, or removed columns.
Selecting Cancel will discard all changes made across both tabs and return you to the report without applying anything.
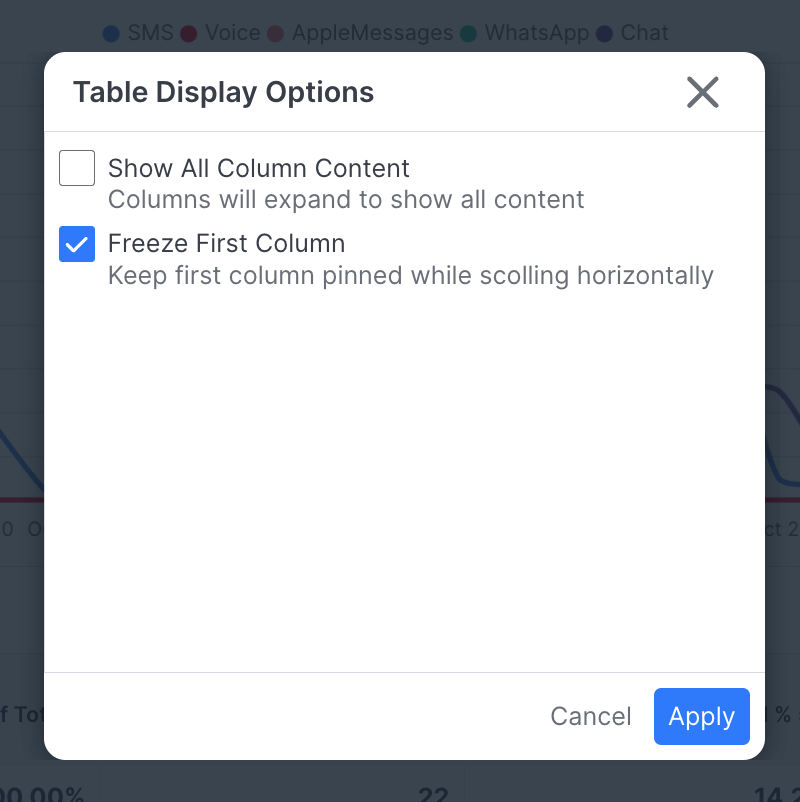
Display Options
The Display Options button in the upper right of the table display can be opened to define display options in the report.
Interacting with a Report
Viewing time series data in the Breakdown Chart
Each value of the breakdown field will be displayed as a separate line in the chart. When there are more than 10 values for a breakdown field, only the top 10 values with the highest Count values will be displayed in the chart.
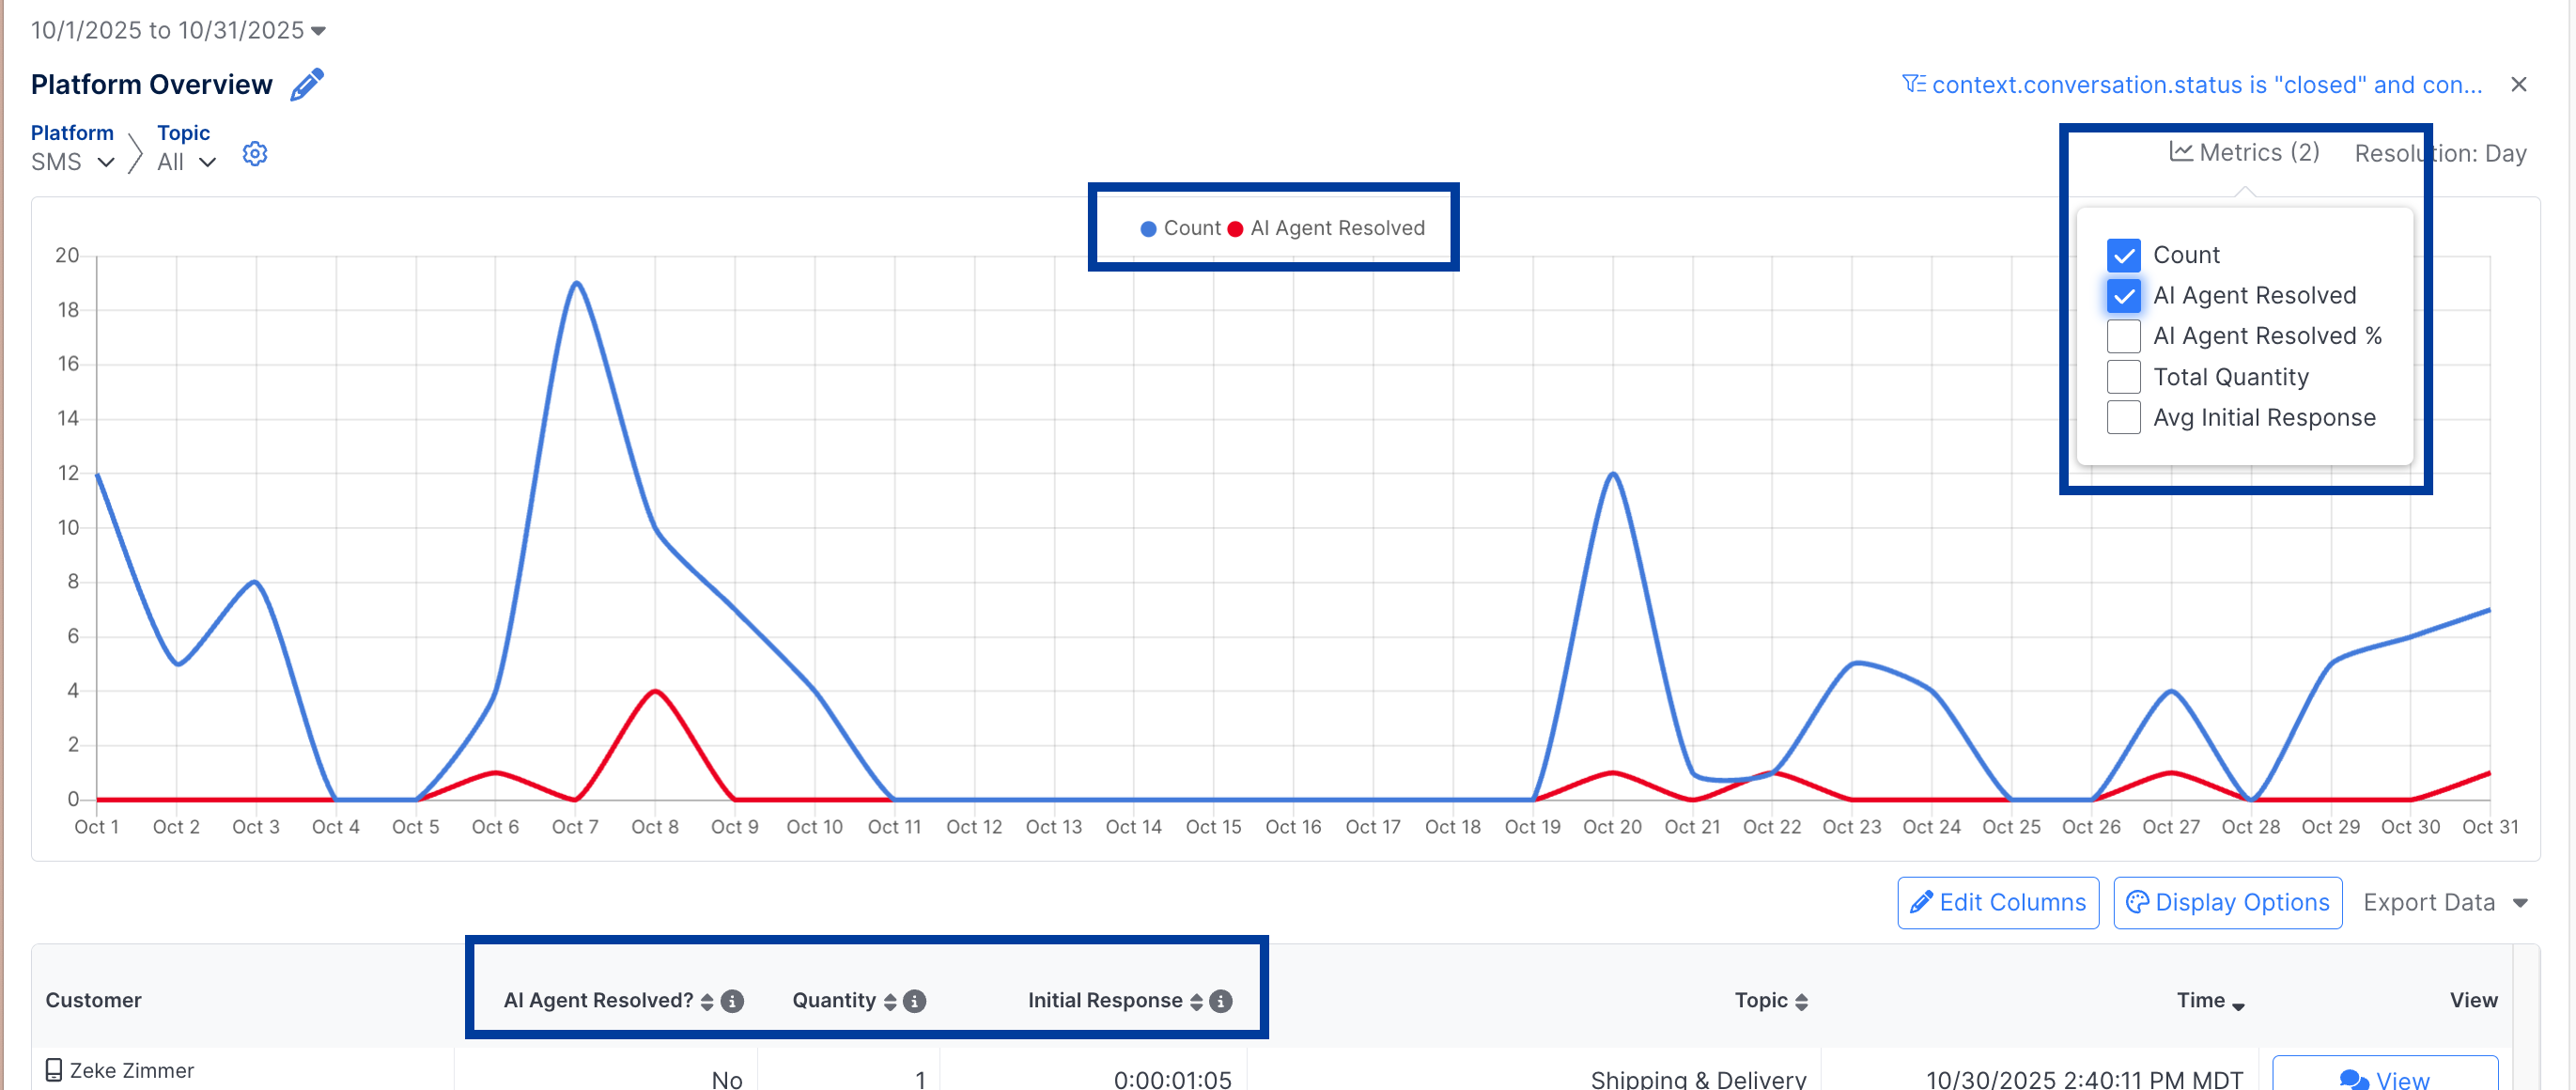
When multiple column metrics have been configured, any can be selected under the metrics button in the Breakdown Chart in order to see that metric calculation over time per breakdown value. The Count column is selected by default but another metric can be selected instead.
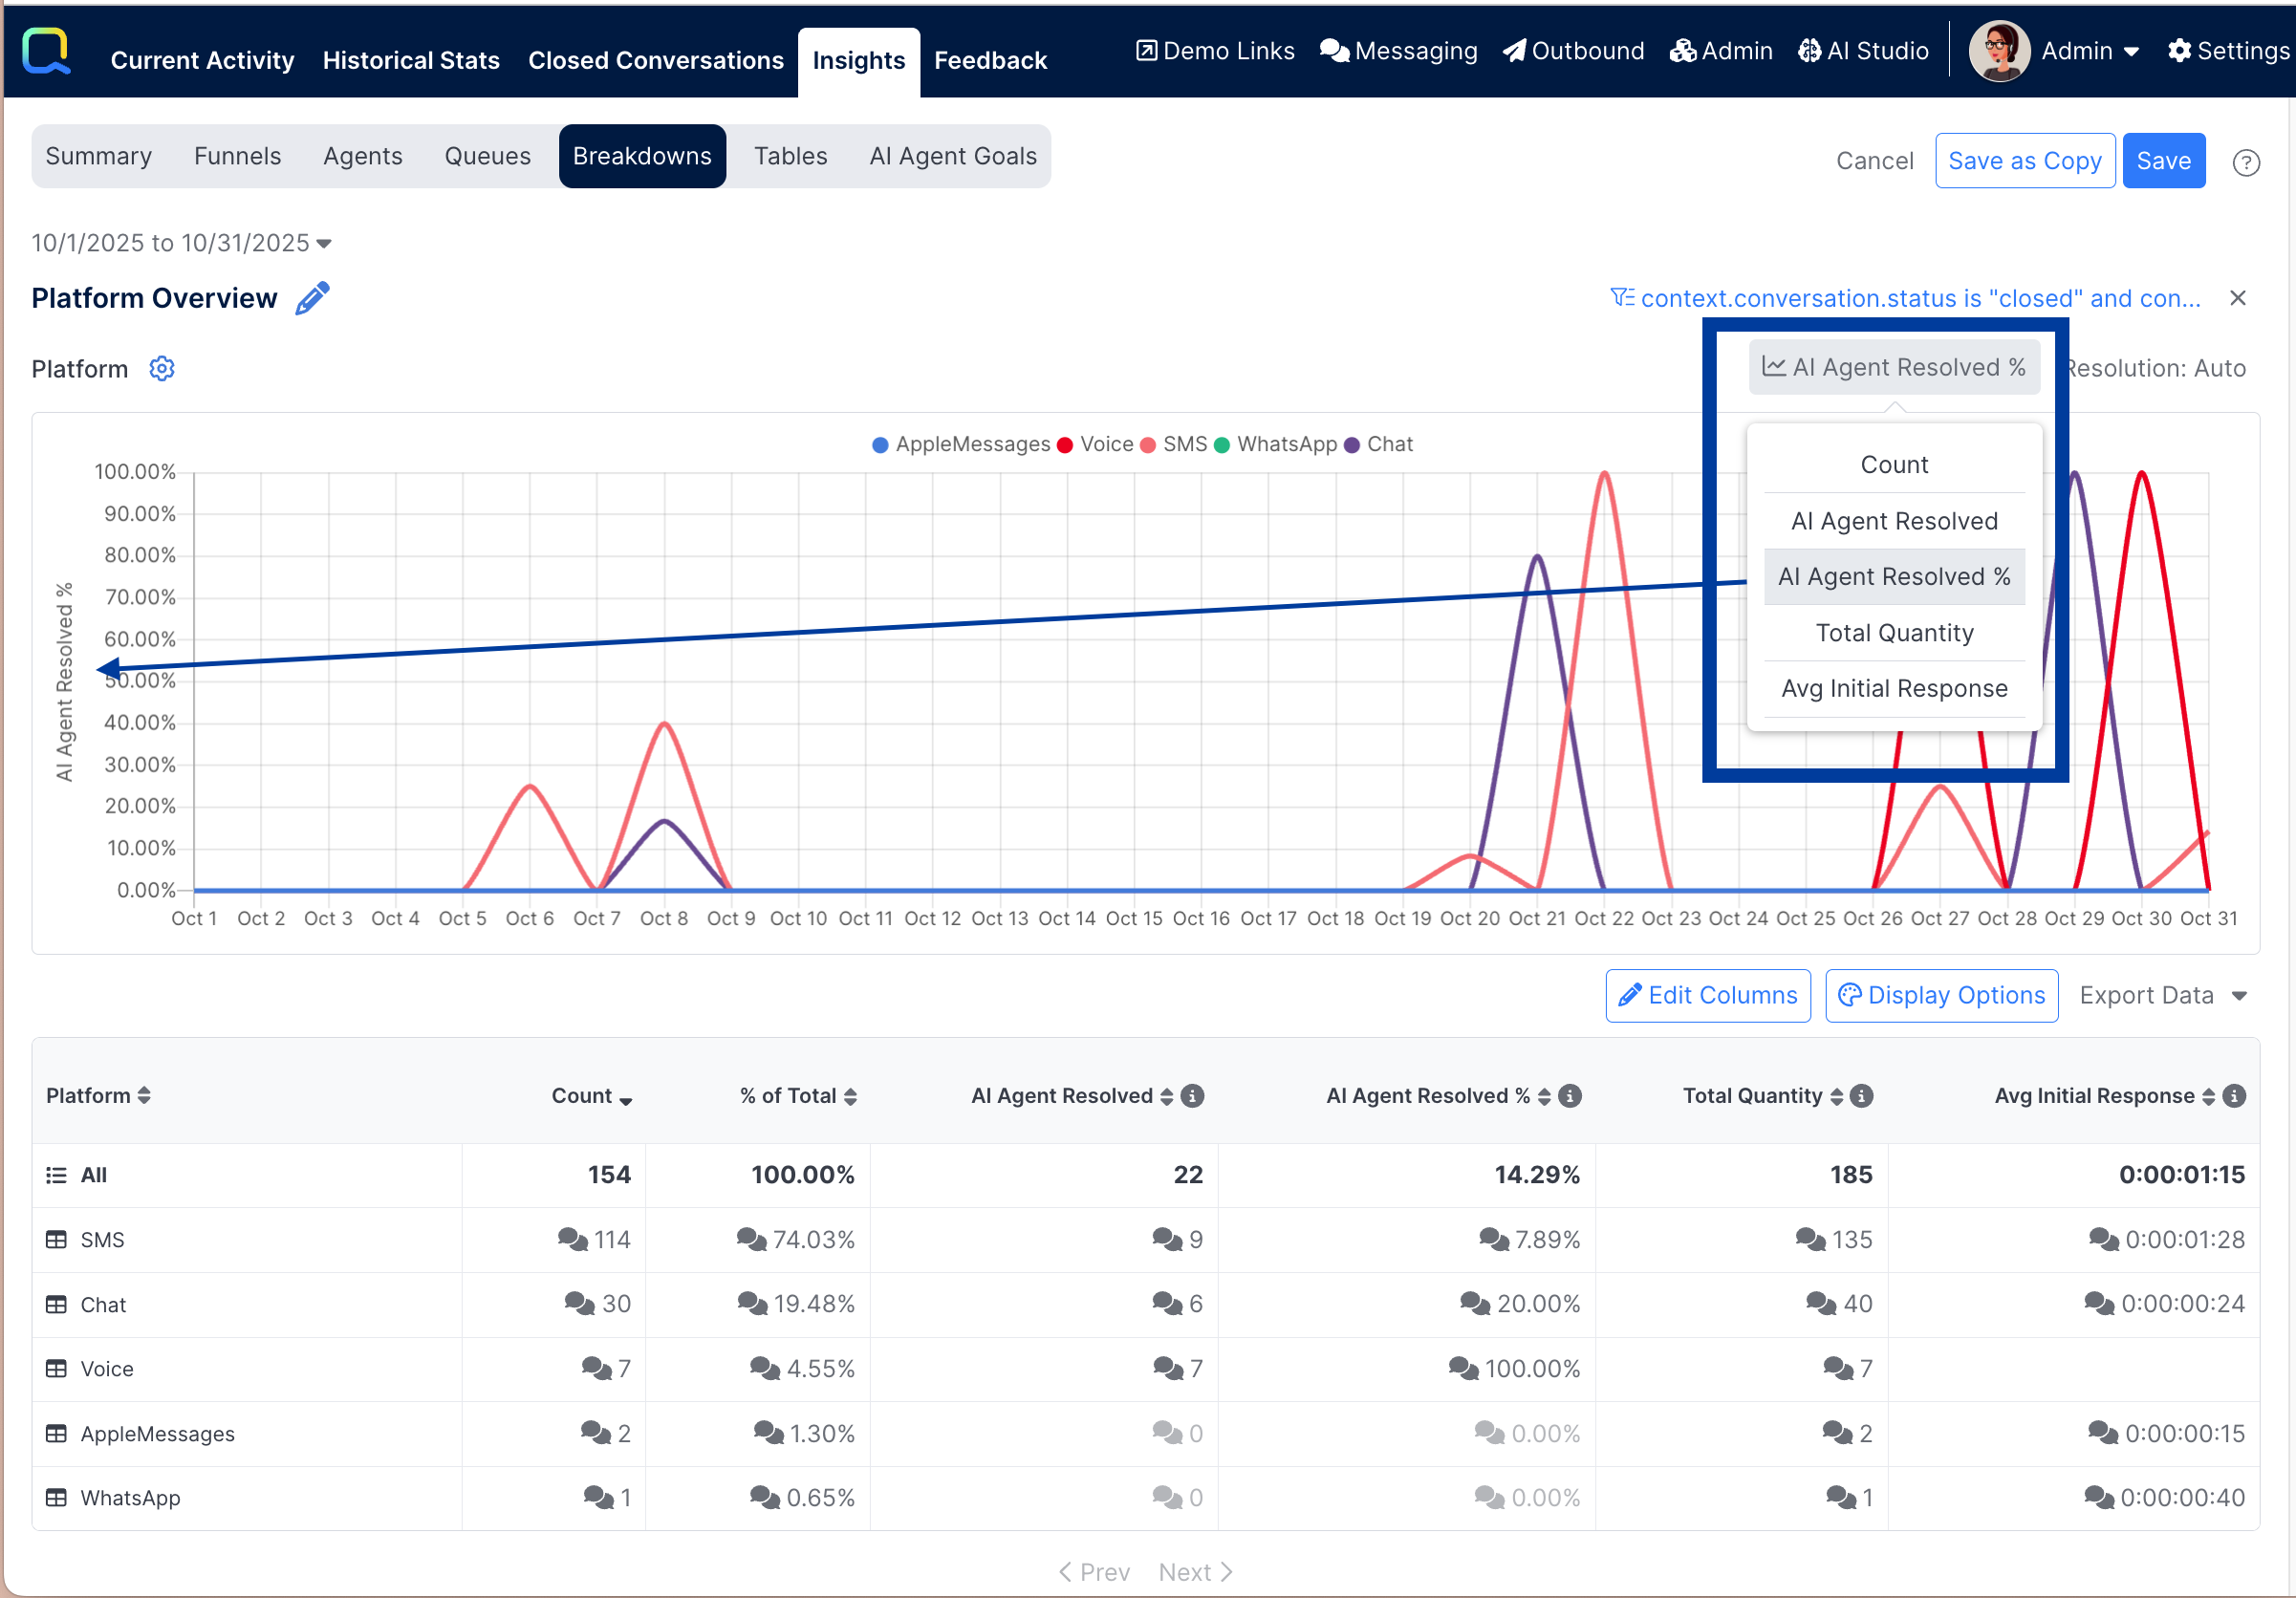
The time series on the x-axis of the chart will vary by the length of the selected time period when the Resolution is set to Auto. Periods less than 2 days will default to display the data by Hour, when longer periods will default to display the data by Day. The units can be changed by selecting the Resolution button and selecting a different unit.
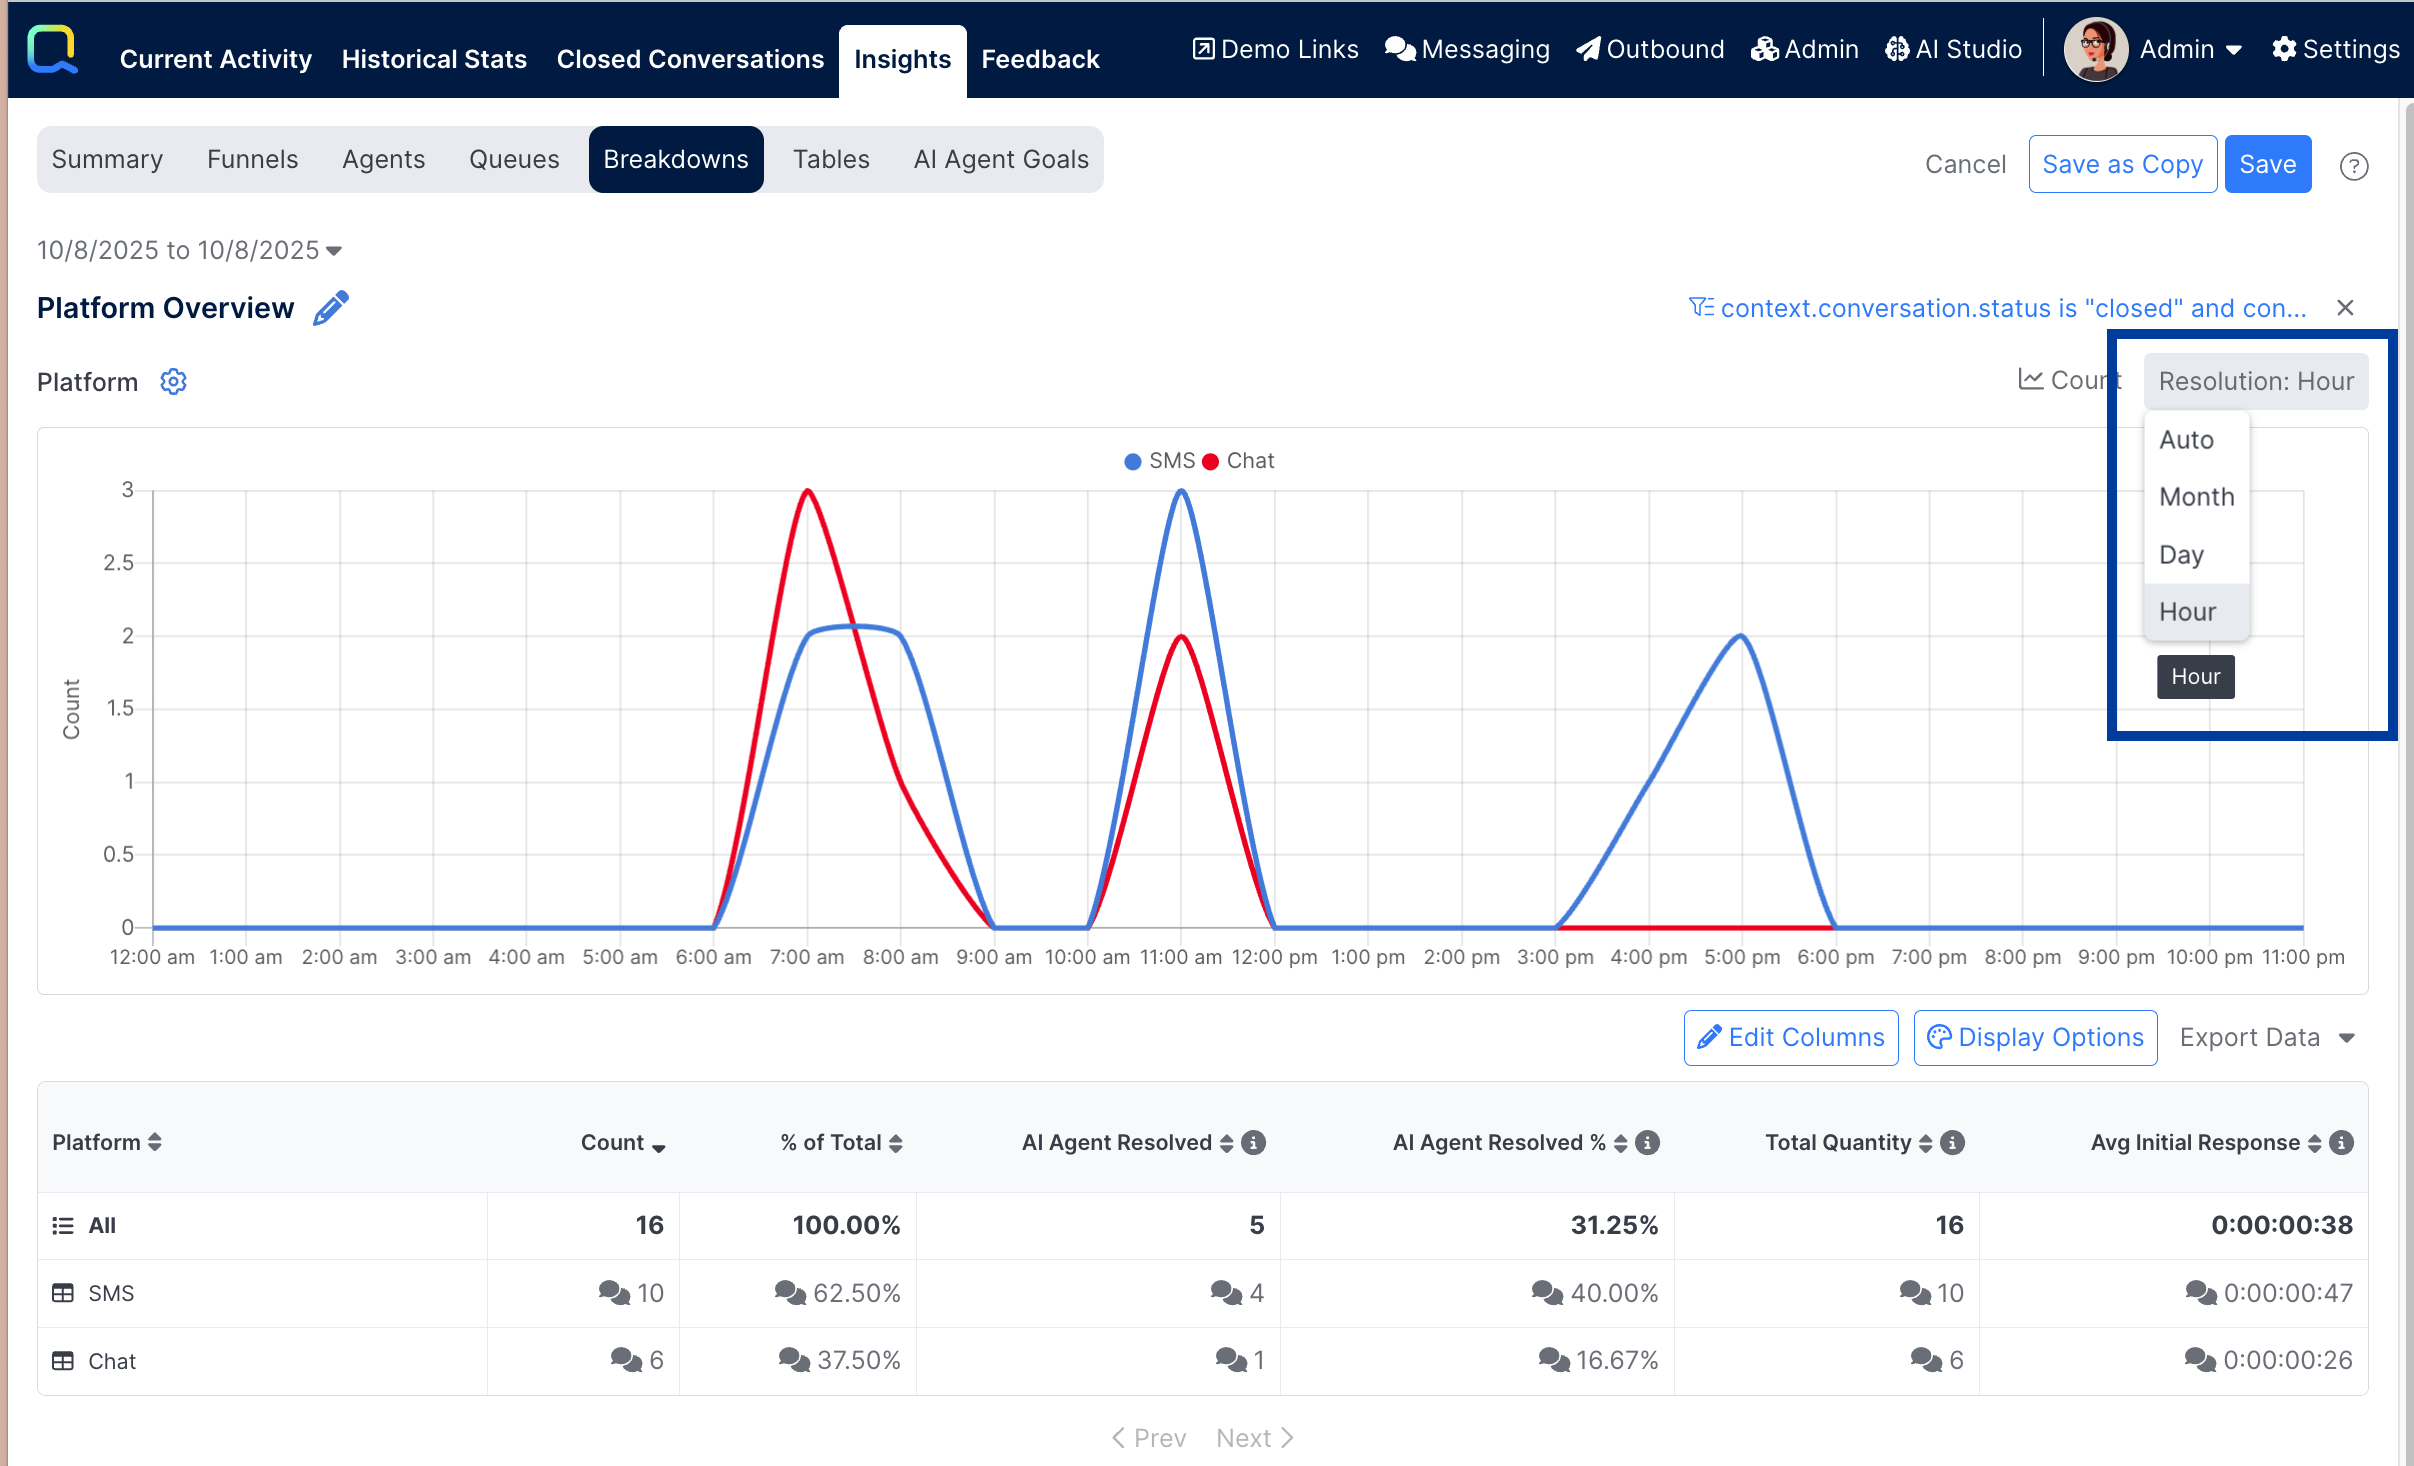
Selecting a new date range will reset the Resolution back to Auto.
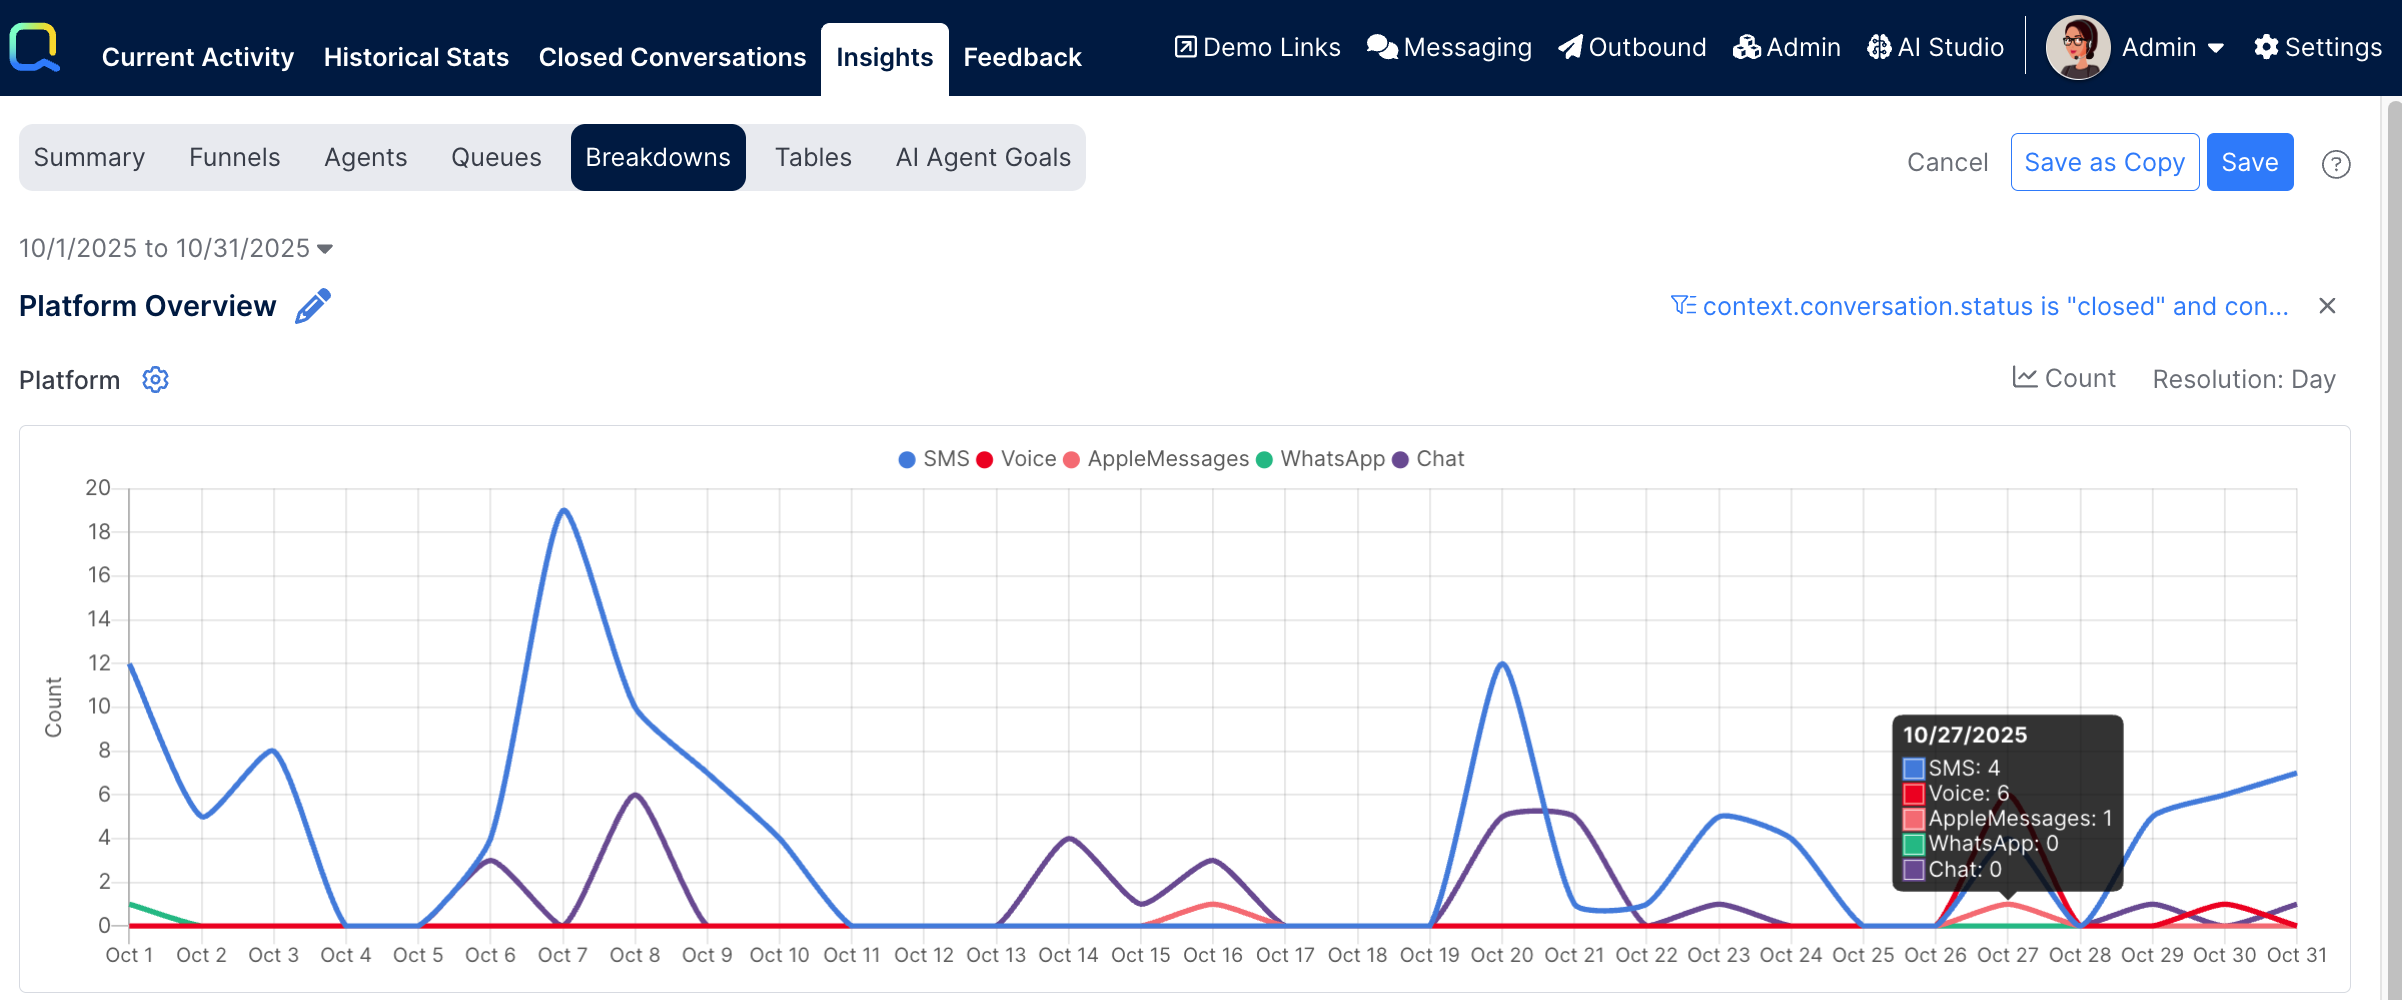
When focus is put on any data point in the time series, a pop-up is opened that displays the data values per breakdown category for the selected time unit.
Conversation Drilldown per Metric
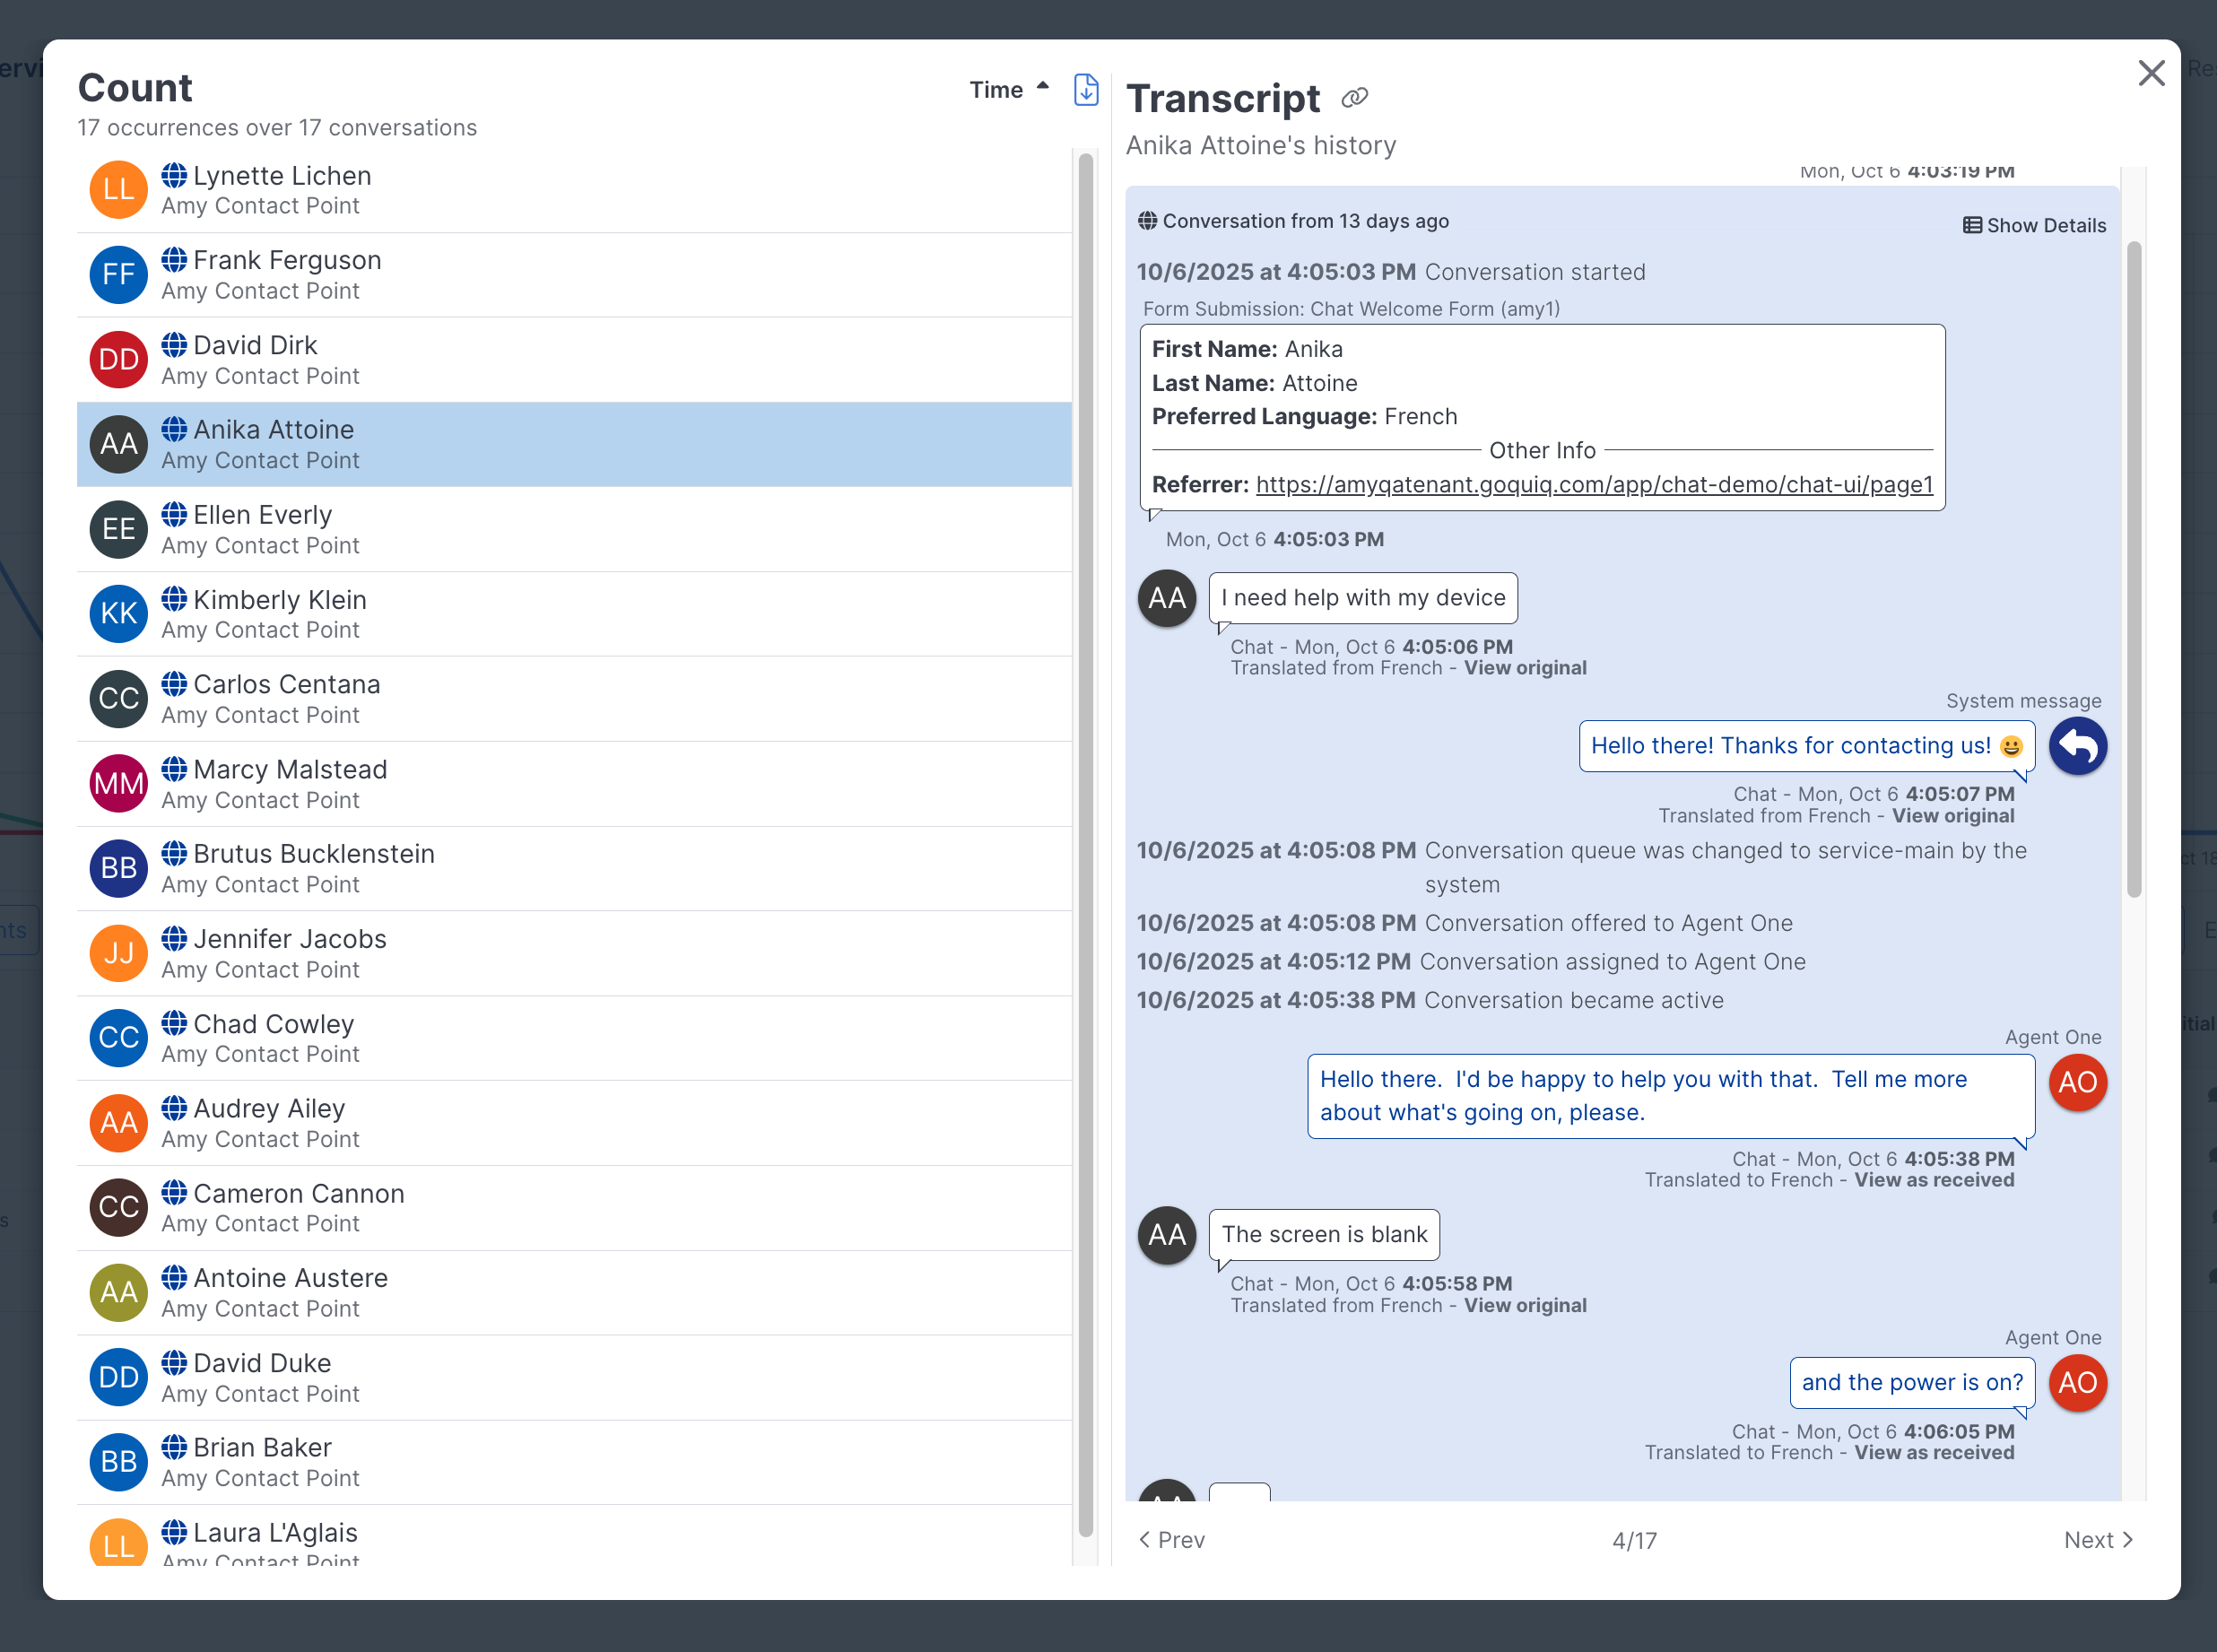
The conversation bubble message image appears next to the values for most metrics displayed in the table. Like with other areas in Insights, this can be selected to view the conversations that were counted when computing the metric. A list of the conversations that generated the events are shown in the left-side pane. Any of those can be selected to show the conversation transcript in the right-side pane. The Export Conversations button can be selected to download a CSV export of the conversation list.
Drilling into Additional Breakdowns
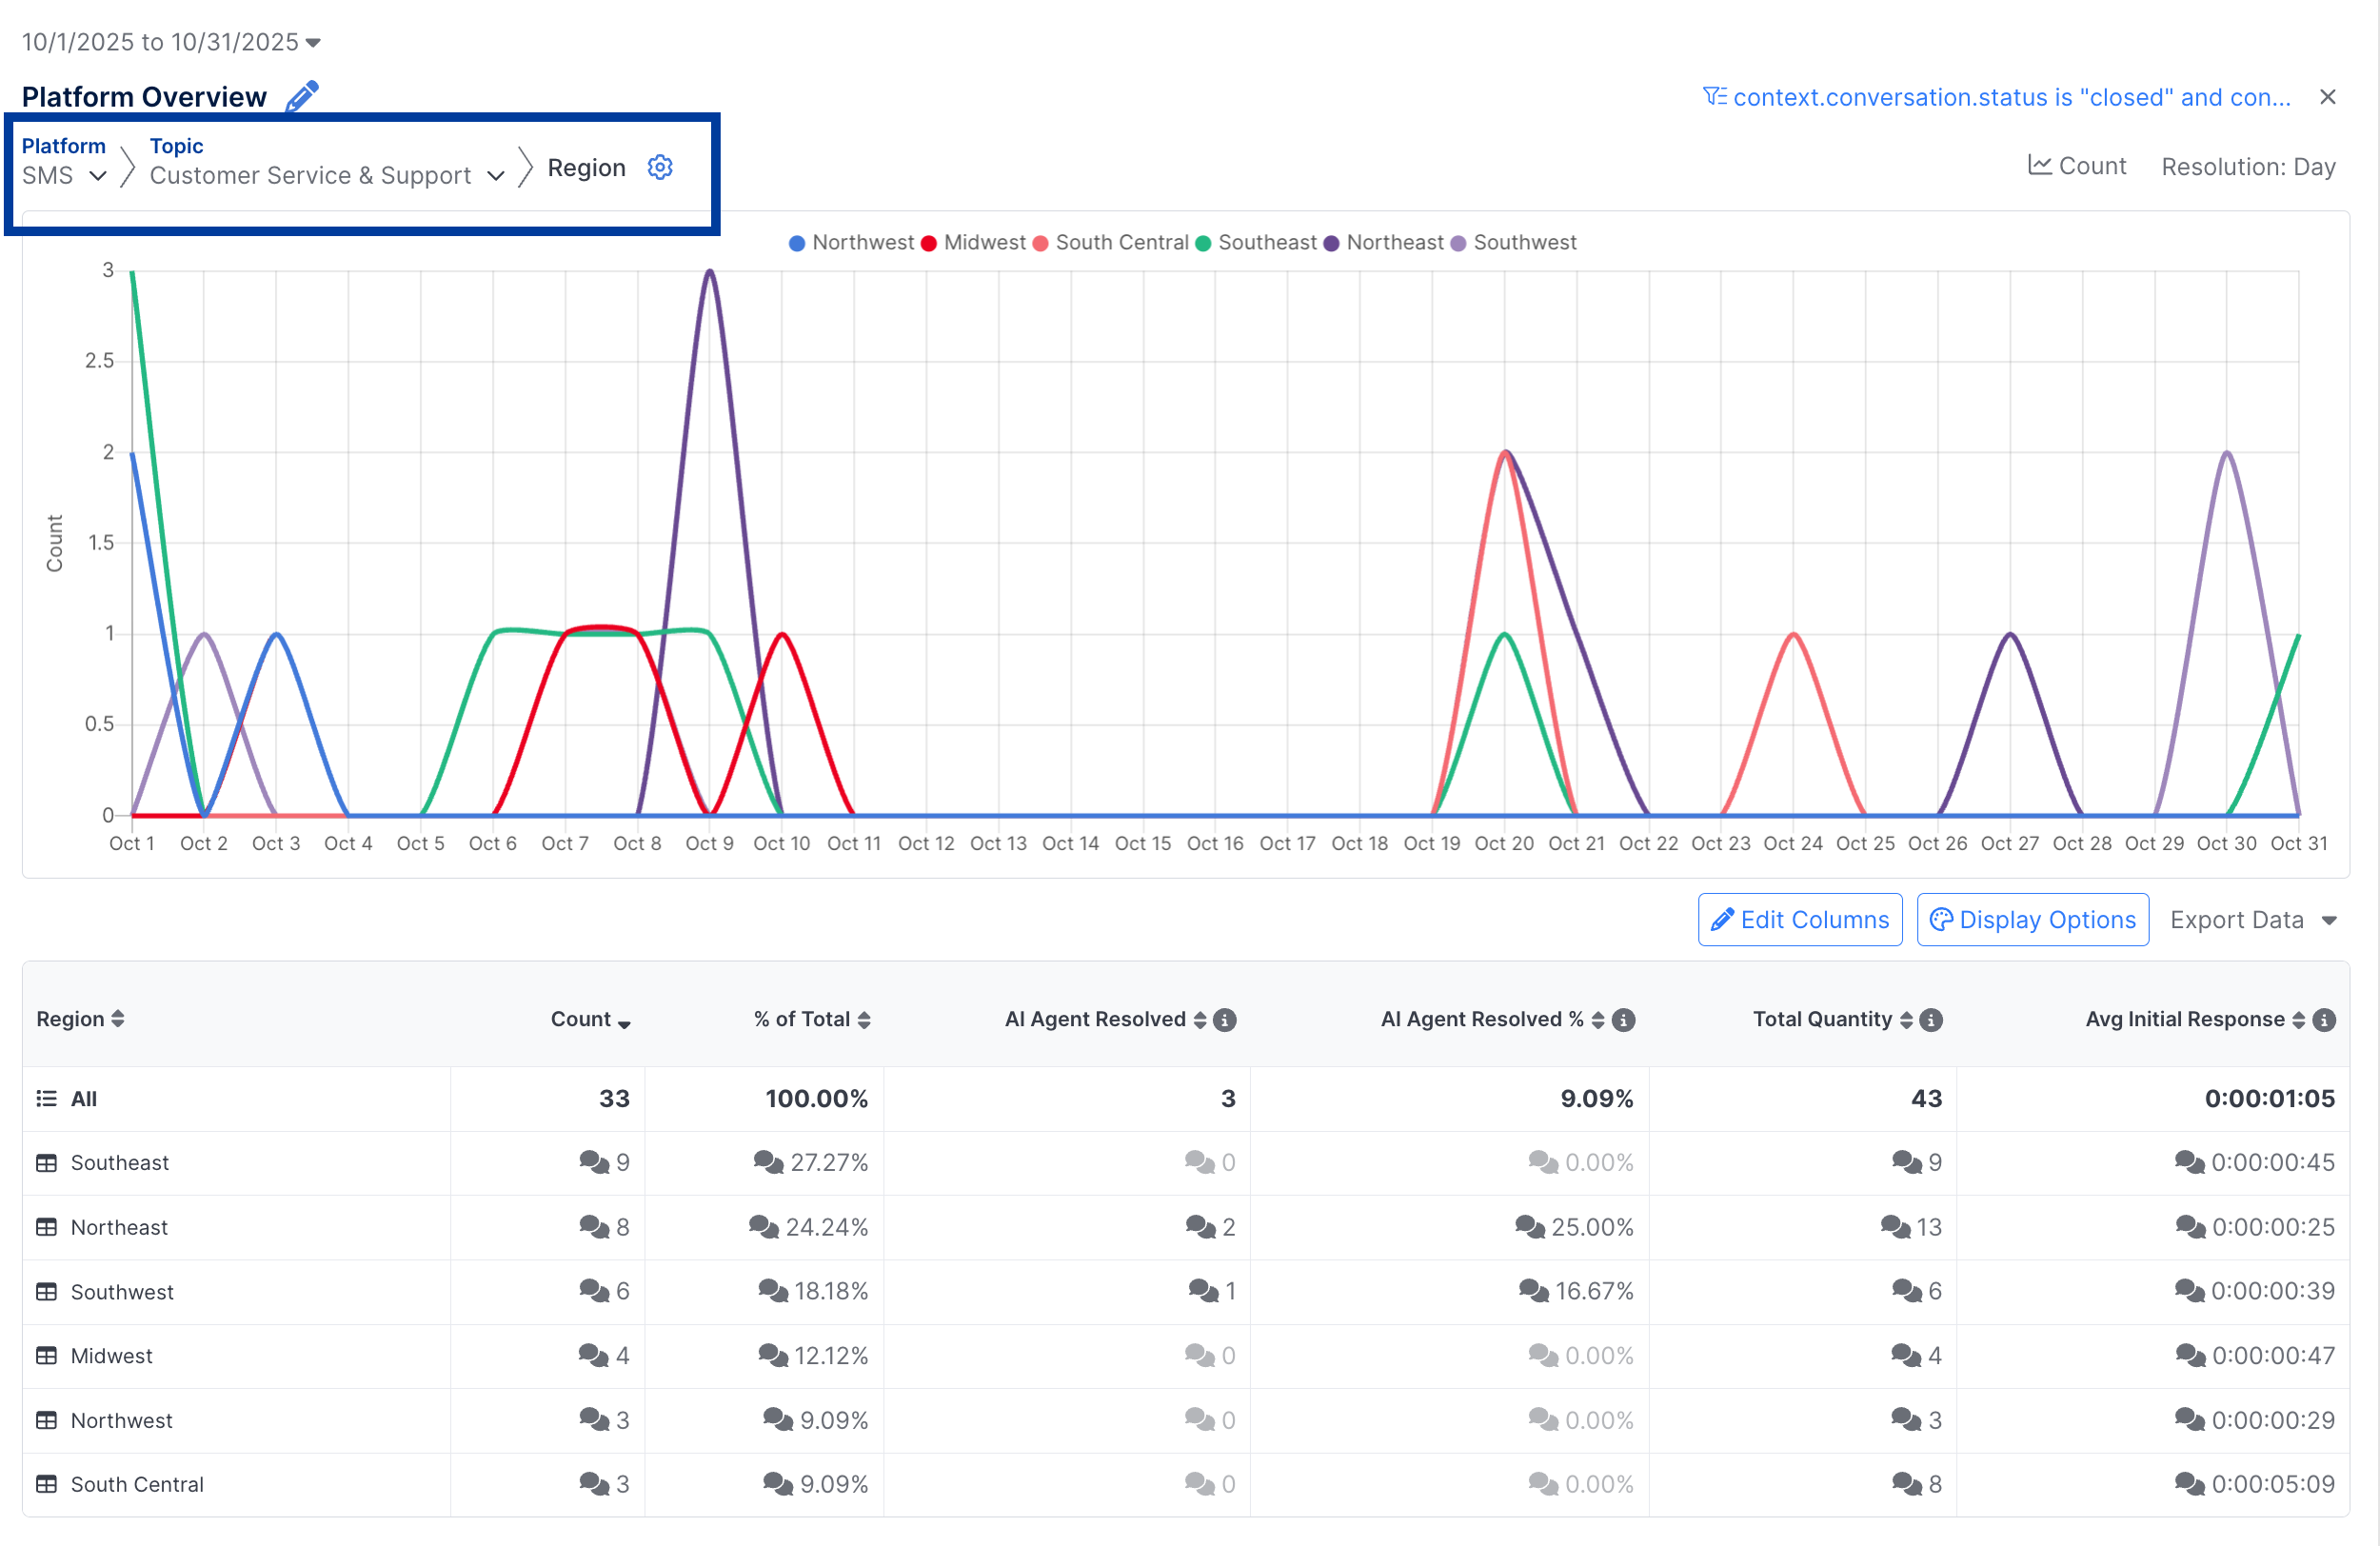
When multiple Breakdown levels have been configured, the user can click on any row to breakdown the data further.
This will provide a new view of data by the next breakdown field where the values of the previous breakdown field are what was on the selected row. Any row of each breakdown level can be selected to show the next defined breakdown - until all the configured breakdown levels have been accessed.
For each level the table data is updated to show the values of the breakdown field for that level. The chart is also updated to show the time series data of the current breakdown field. The same set of metrics are returned at each level. Conversation drilldowns and export options are available at any level.
A breadcrumb navigation bar at the top of the report will display:
- The breakdown field for the previous level(s)
- The value of the breakdown field that was drilled into
- The breakdown field for the current level
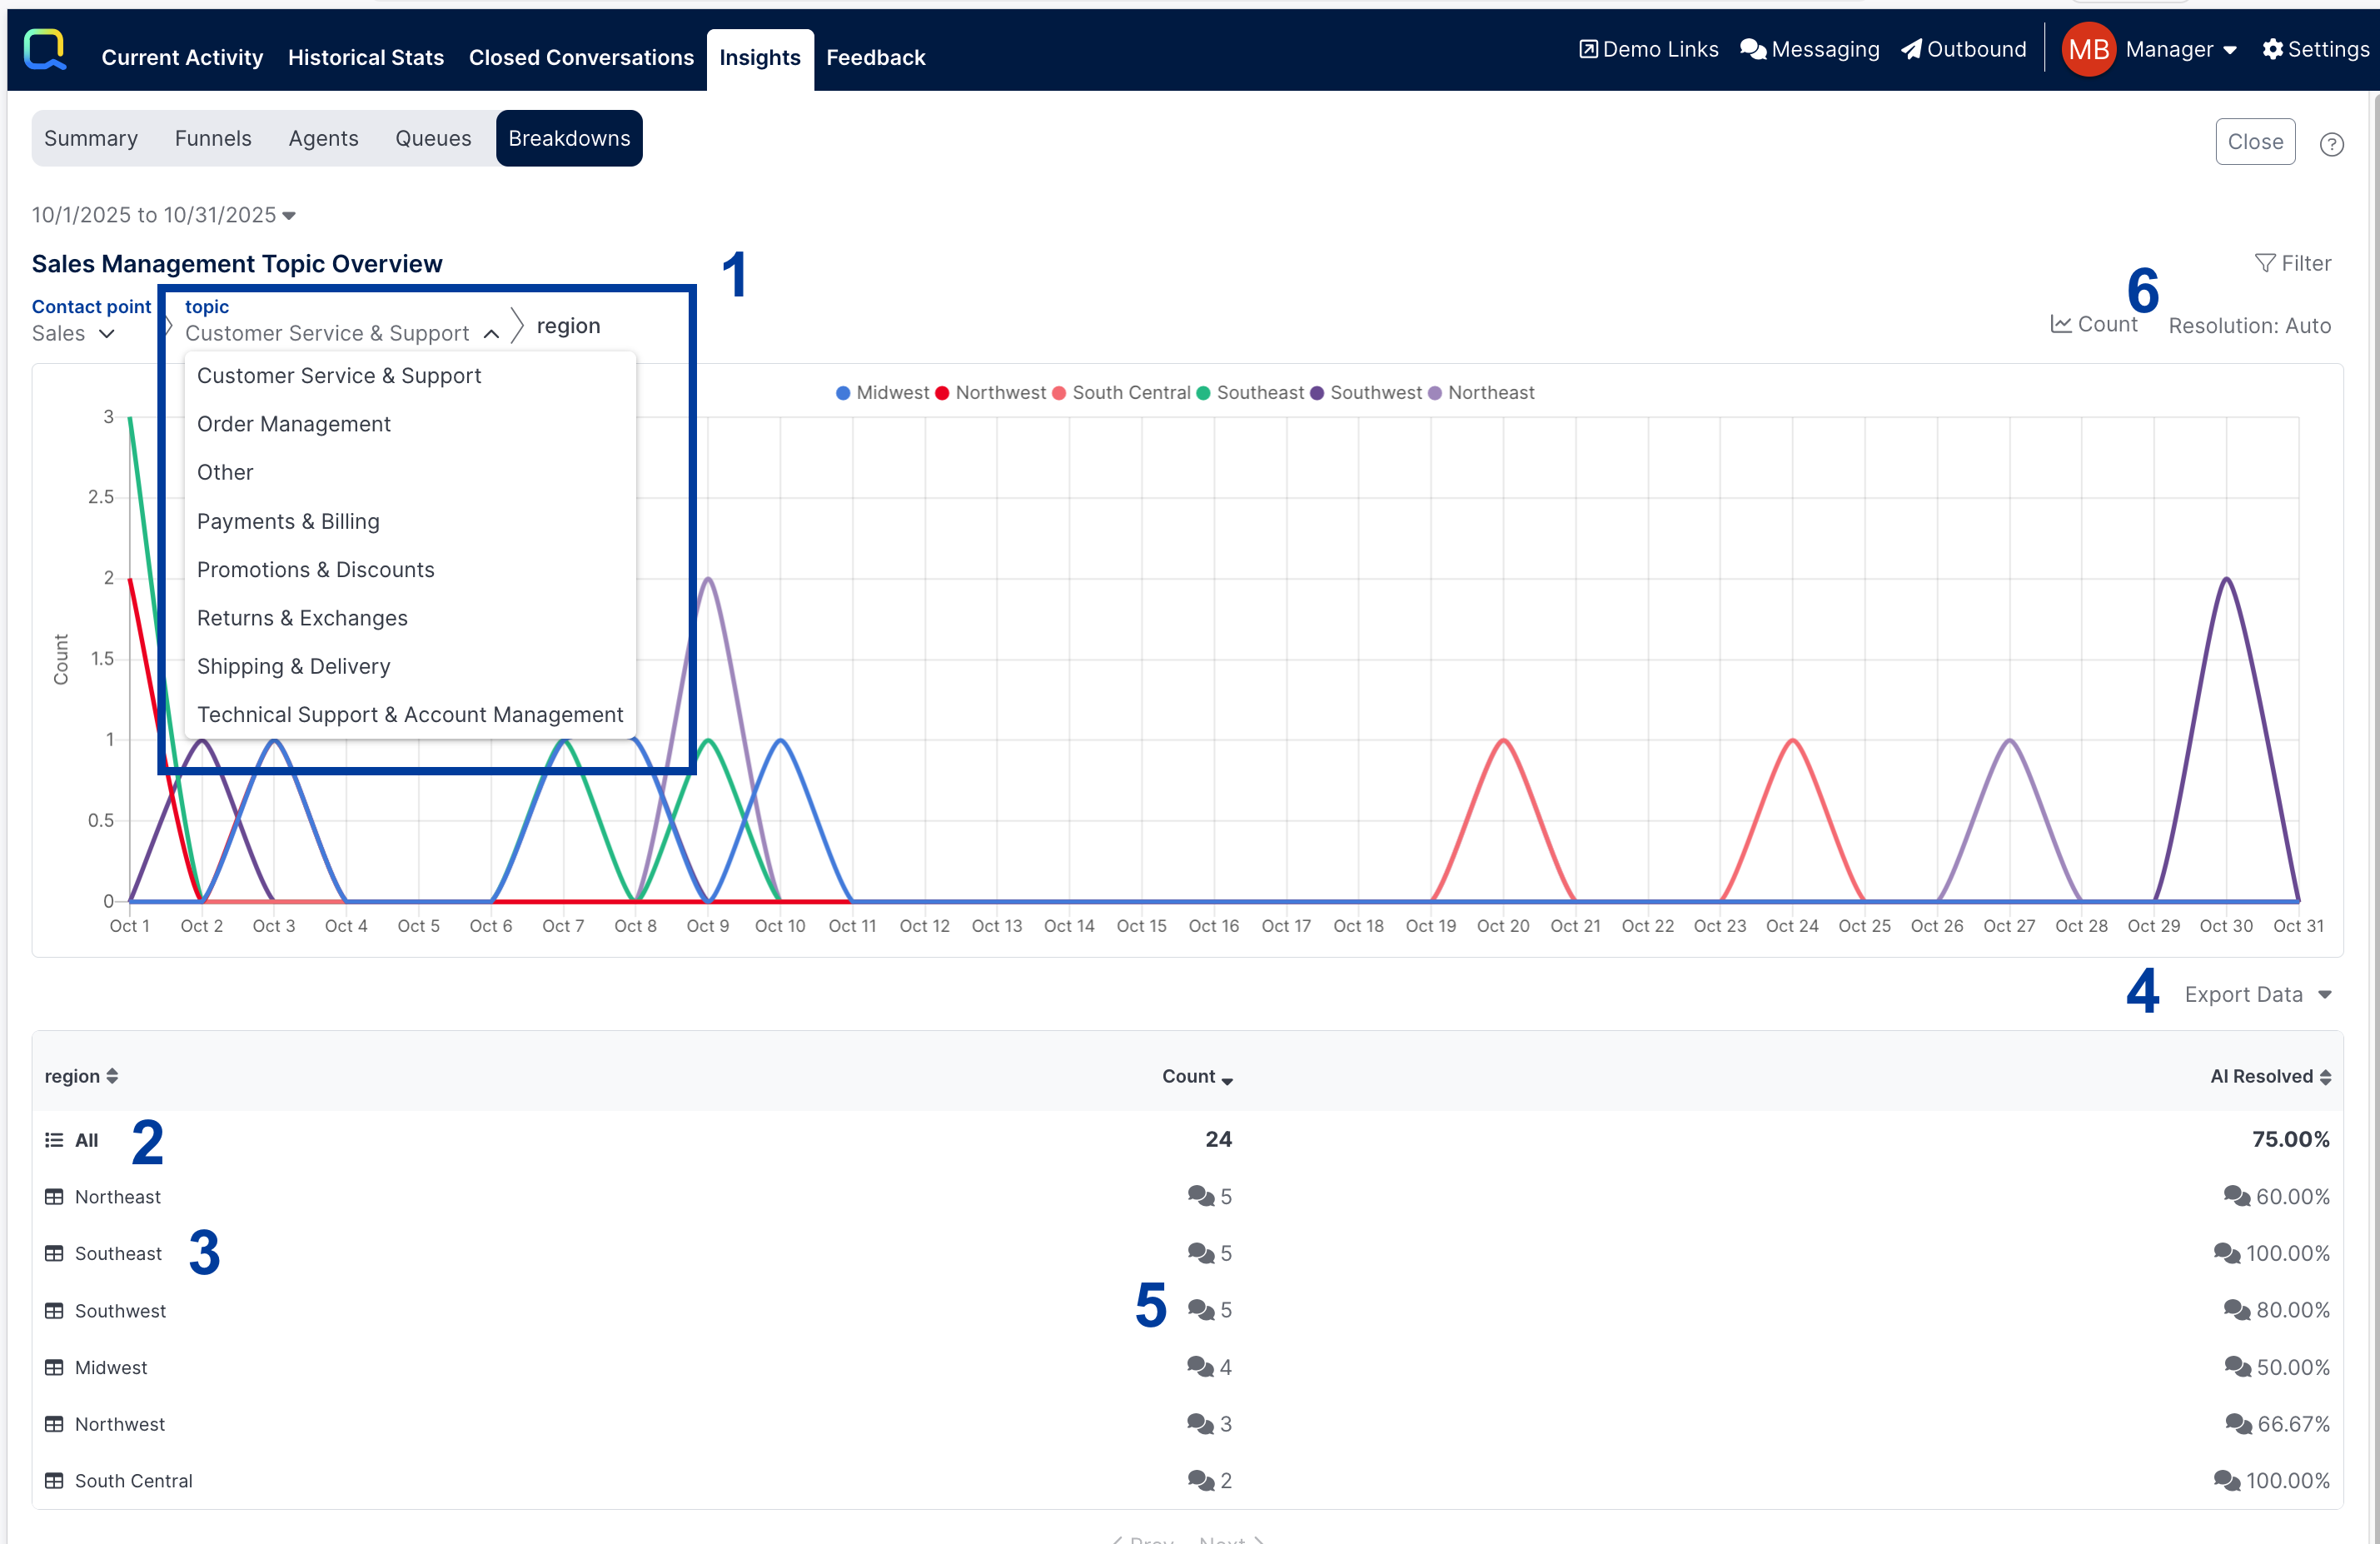
Using the Interactive Breadcrumb Navigation
When drilled into an additional breakdown level(s), the breadcrumb path can also be used to navigate by changing the breakdown values that were selected without have to drill up and back down along another path.
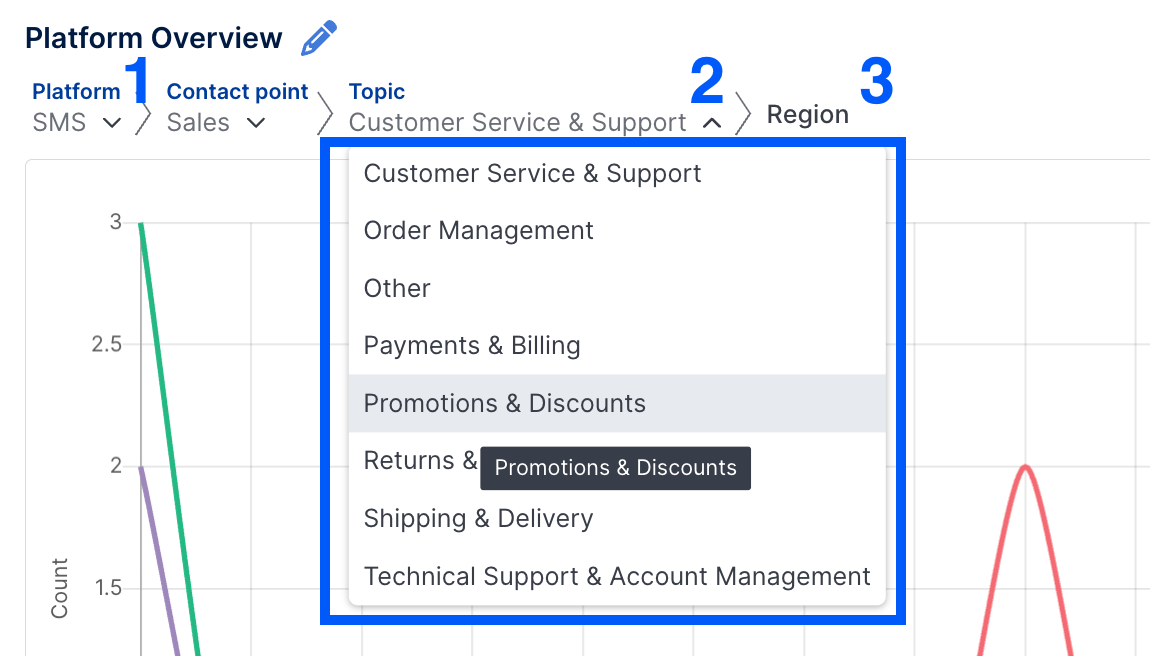
1. Select the name of any breakdown field of a previous level (displayed in blue) to return to that level viewing the data broken down by that field.
2. Expand the list next to any breakdown field value to select another option to see the results for that set of breakdowns.
3. The rightmost will display the field that you are currently viewing data by.
The selected value for any breakdown can only be changed via the breadcrumb navigation for select-type fields - that is, fields that have a menu. The drop-down menu is not available for free form text fields.
Viewing Events
The individual events that are counted for each breakdown level can also be viewed by drilling into the All row in the table display. at any level.
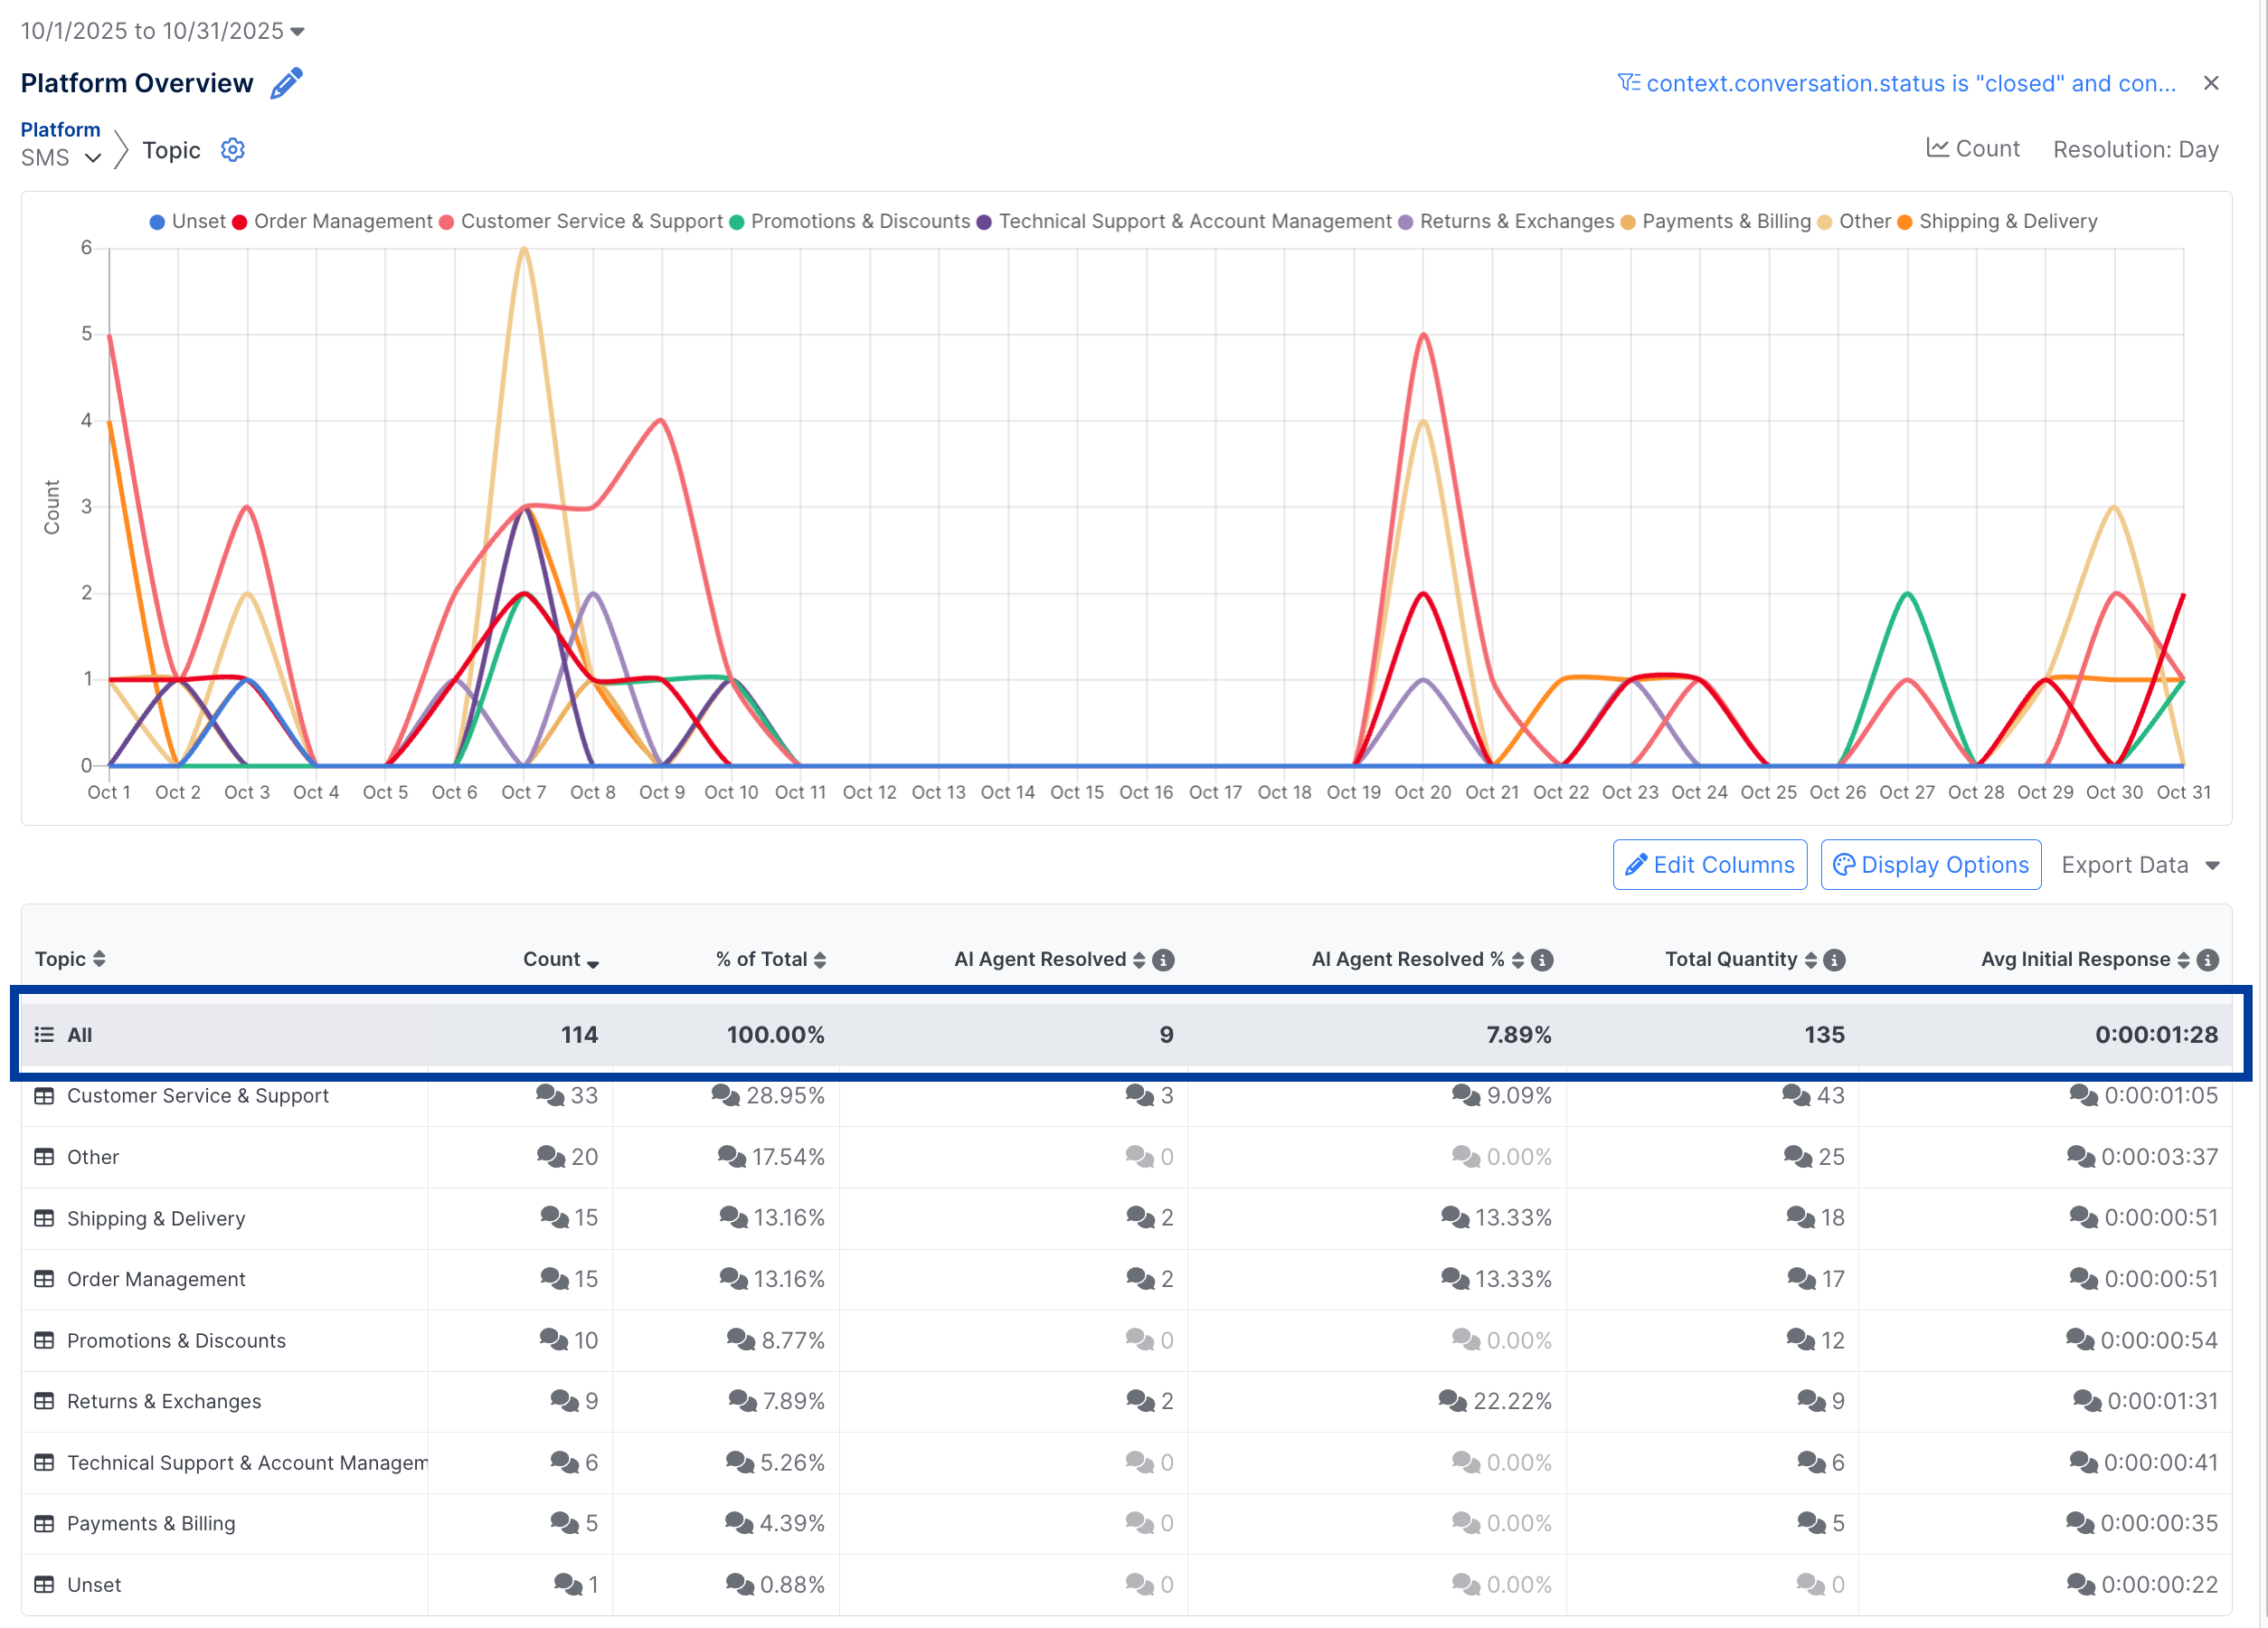
When selected, this takes you to the Event List view of the data.
Like the Breakdown display, the Event List also displays the data in chart, showing the time series data for the selected events for some metric, and a table showing data about the individual events included in that break down.
Selecting any row in the last defined breakdown level will automatically open the Event List view.
Use the breadcrumb navigation and click the blue link of any breakdown field name to return that breakdown view.
Event Time Series Chart
By default, the Count metric will be displayed in the chart, showing the number of events that occurred over the selected time period. The Metrics button in the upper right of the chart can be selected to choose different - or even multiple metrics - to display. Any of the metrics that were added as columns in the Breakdown view will be available to add as lines to the chart.
For best results in chart display, use care when selecting metrics with different types of units - like a count and an average duration - as the scale difference may make interpreting the chart more difficult.
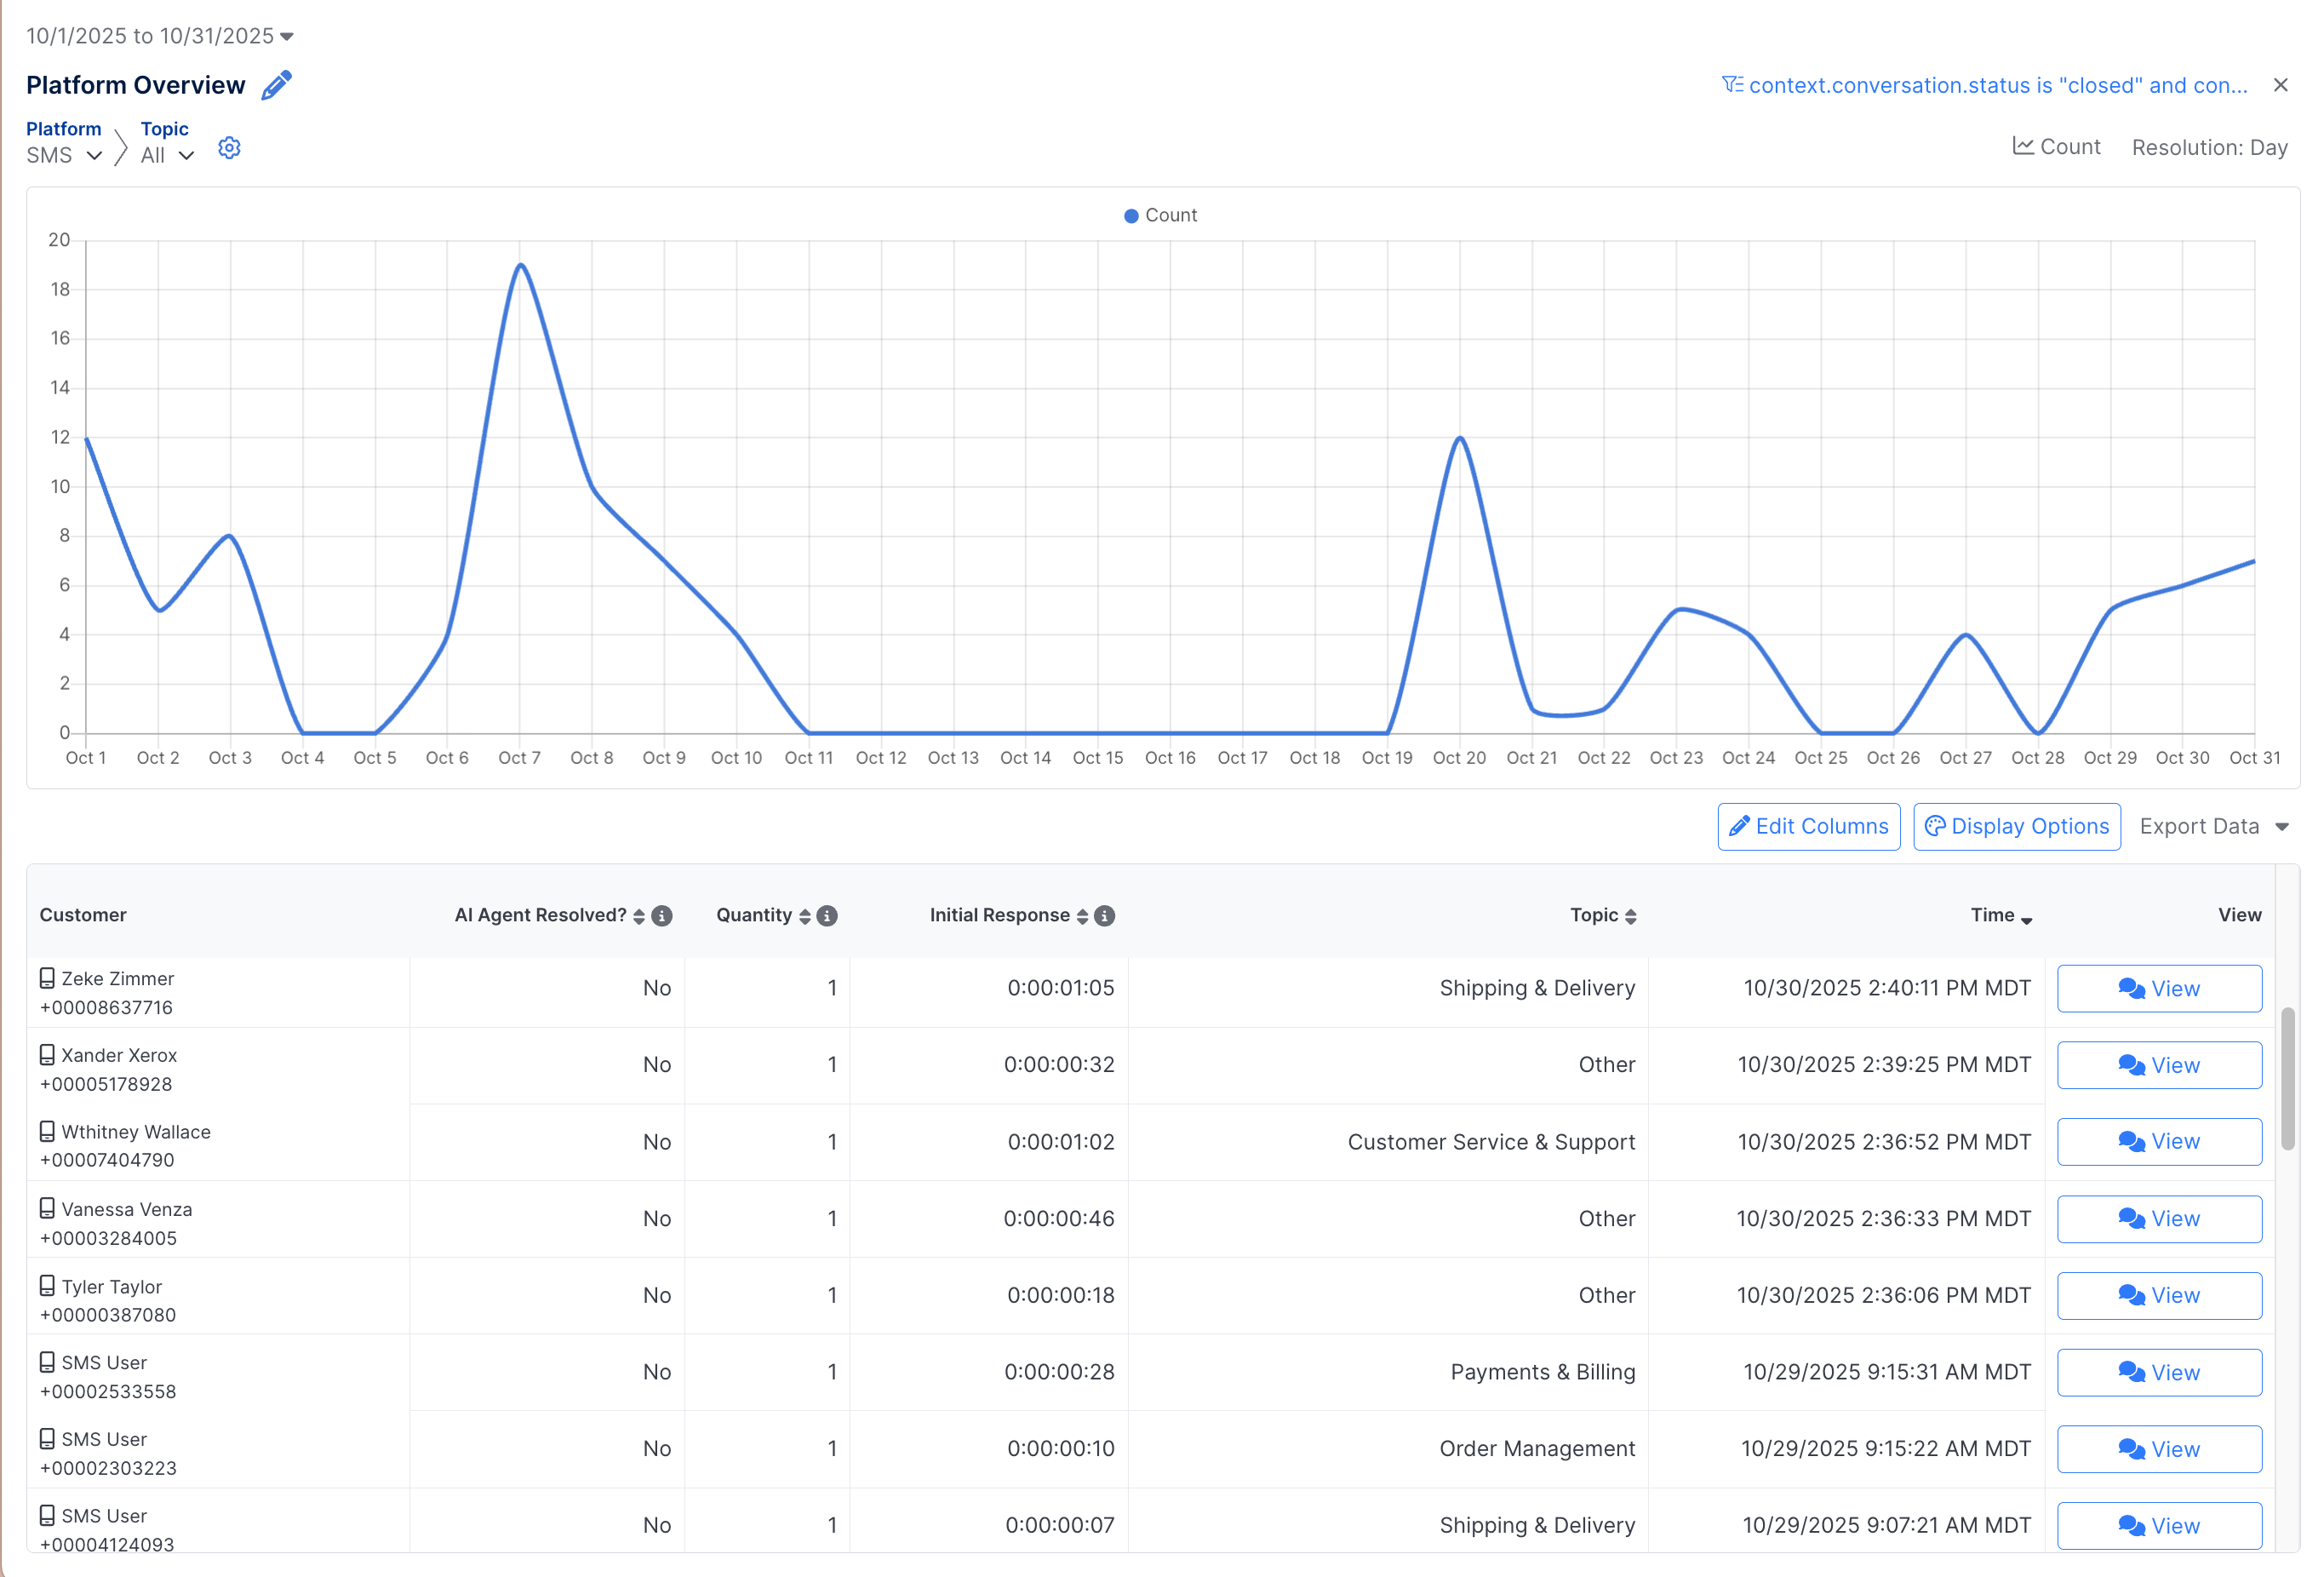
Event List Table
A list of the events matching the report filter criteria as well as all the breakdown field values for the current level will determine the list of events that are returned in the table.
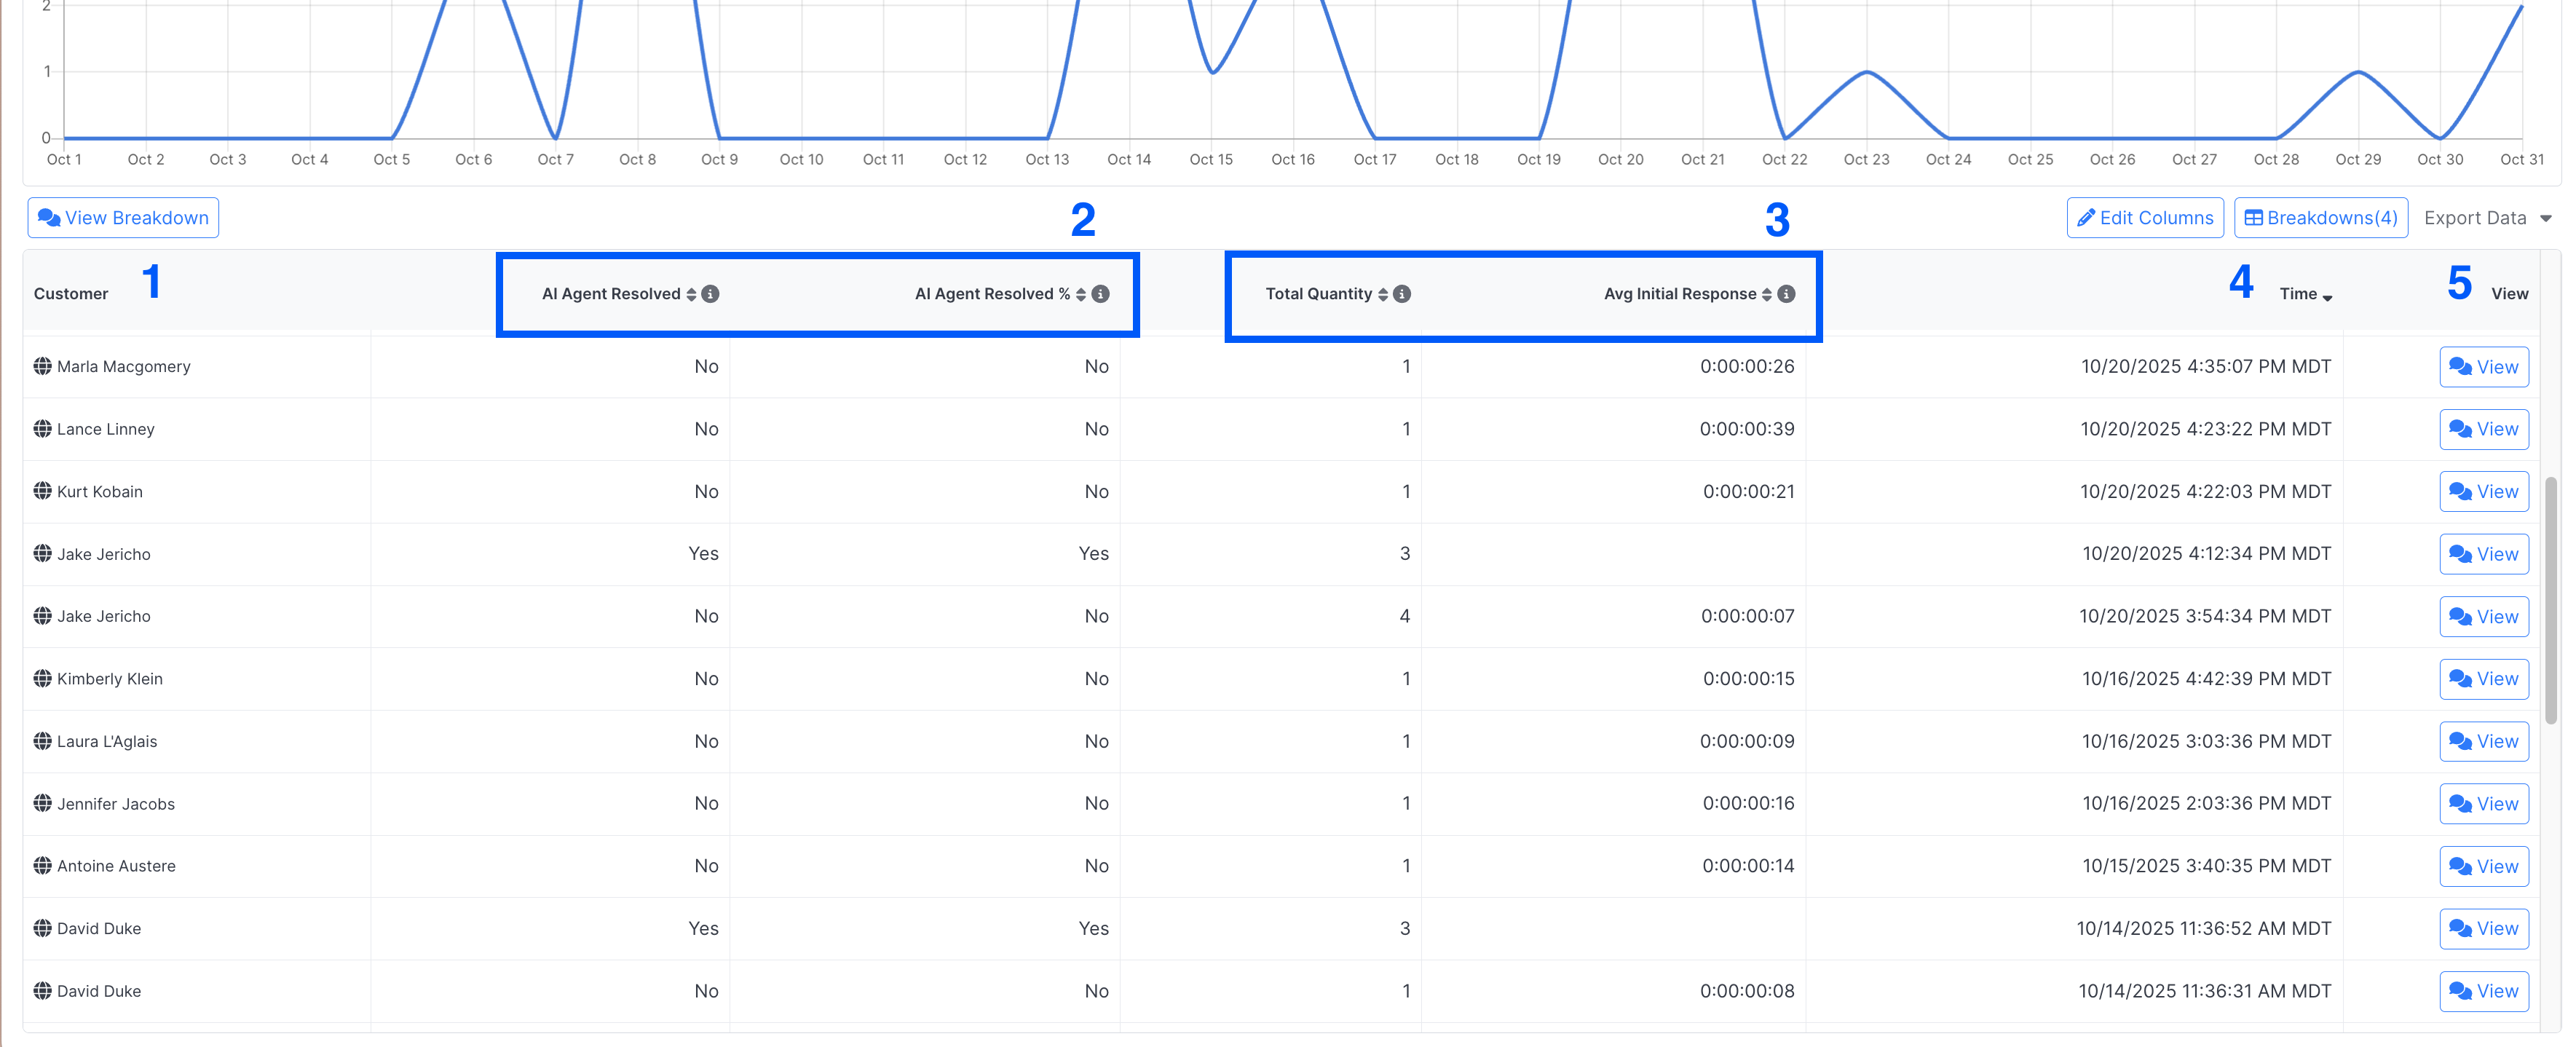
The following columns will be returned by default on the Event List:
1. Customer: The customer first and last name (if available) along with the phone number (when applicable). The image for the platform of the conversation will also be included.
2. A Yes or No indicator for every configured metric that is a Count or Rate indicating if that event was included in the metric. That is, if the listed event matched the constraints for each of those defined columns.
3. The value for the field for every configured metric that is a Average, Percentile or Sum.
4. Time: The date/time the event occurred (e.g. the time the conversation ended for Conversation ended events).
5. View: Provides a button that allows the user to open the conversation associated with the event in order to review the transcript and other details.
Exporting the data
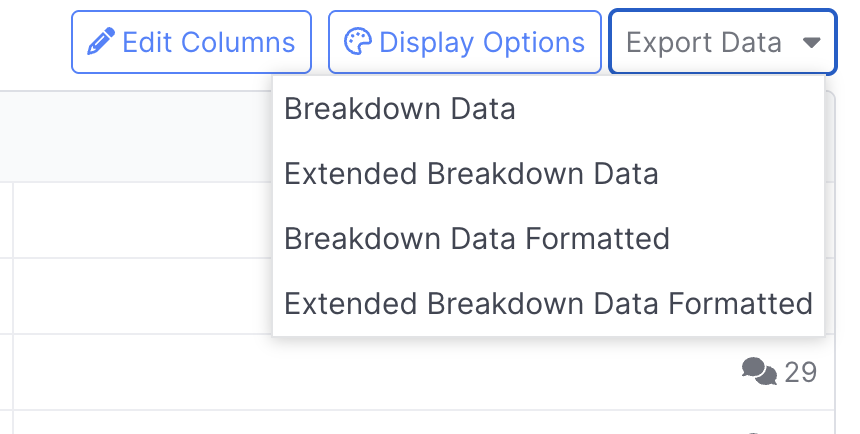
The metrics in any breakdown level can be exported to a standard CSV file by selecting the Export Data option in the upper right of the table. Several options are available:
- Breakdowns Data
- Extended Breakdown Data
- Breakdowns Data Formatted
- Extended Breakdown Data Formatted
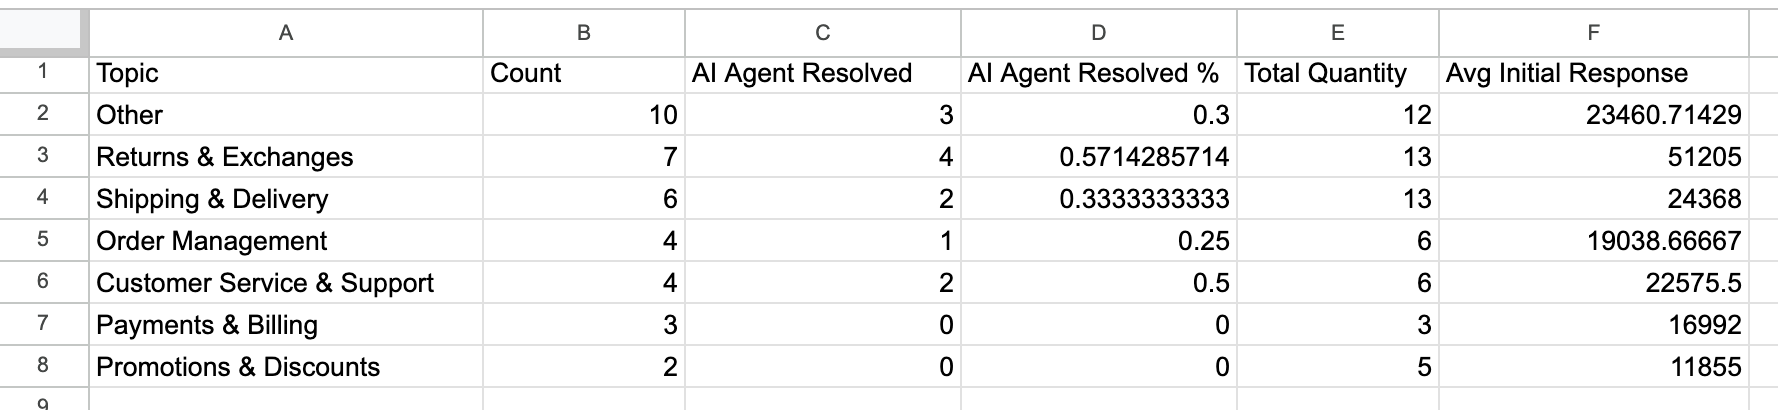
Breakdown Data
The standard export option will provide the raw unformatted data for the metrics in the report. In general this means, that display to specified decimal places and special time duration formatting seen in the UI will not be applied in the exported file.
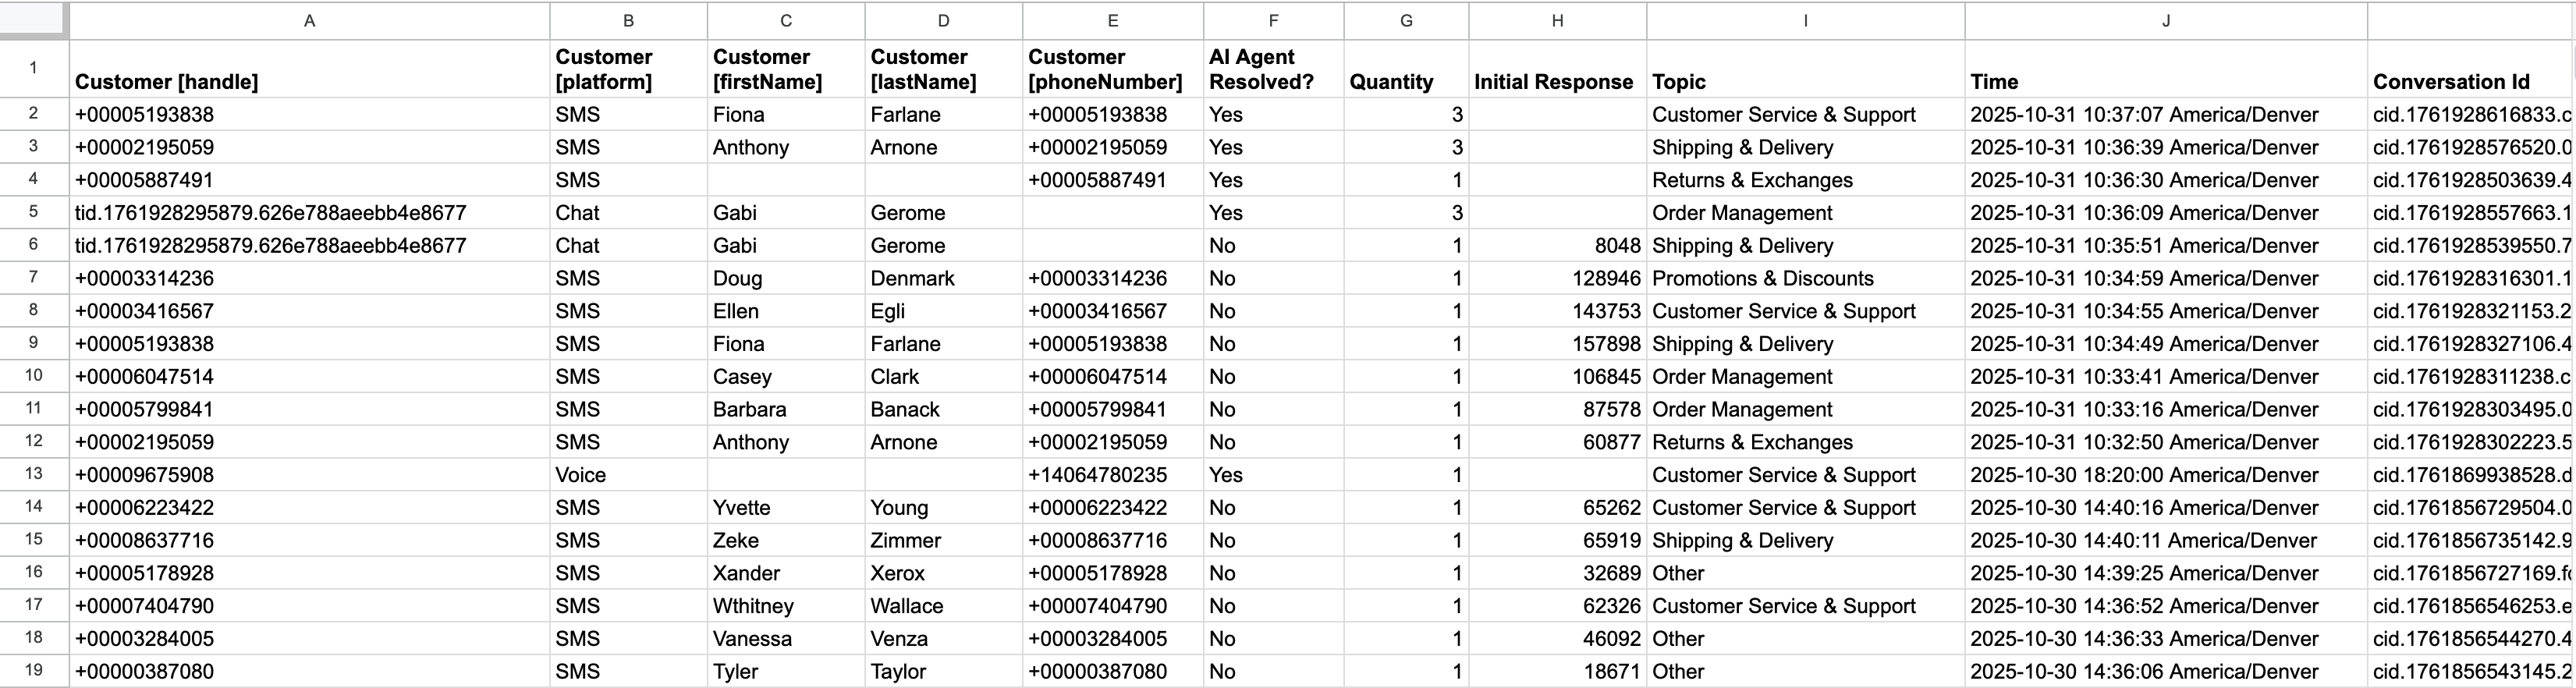
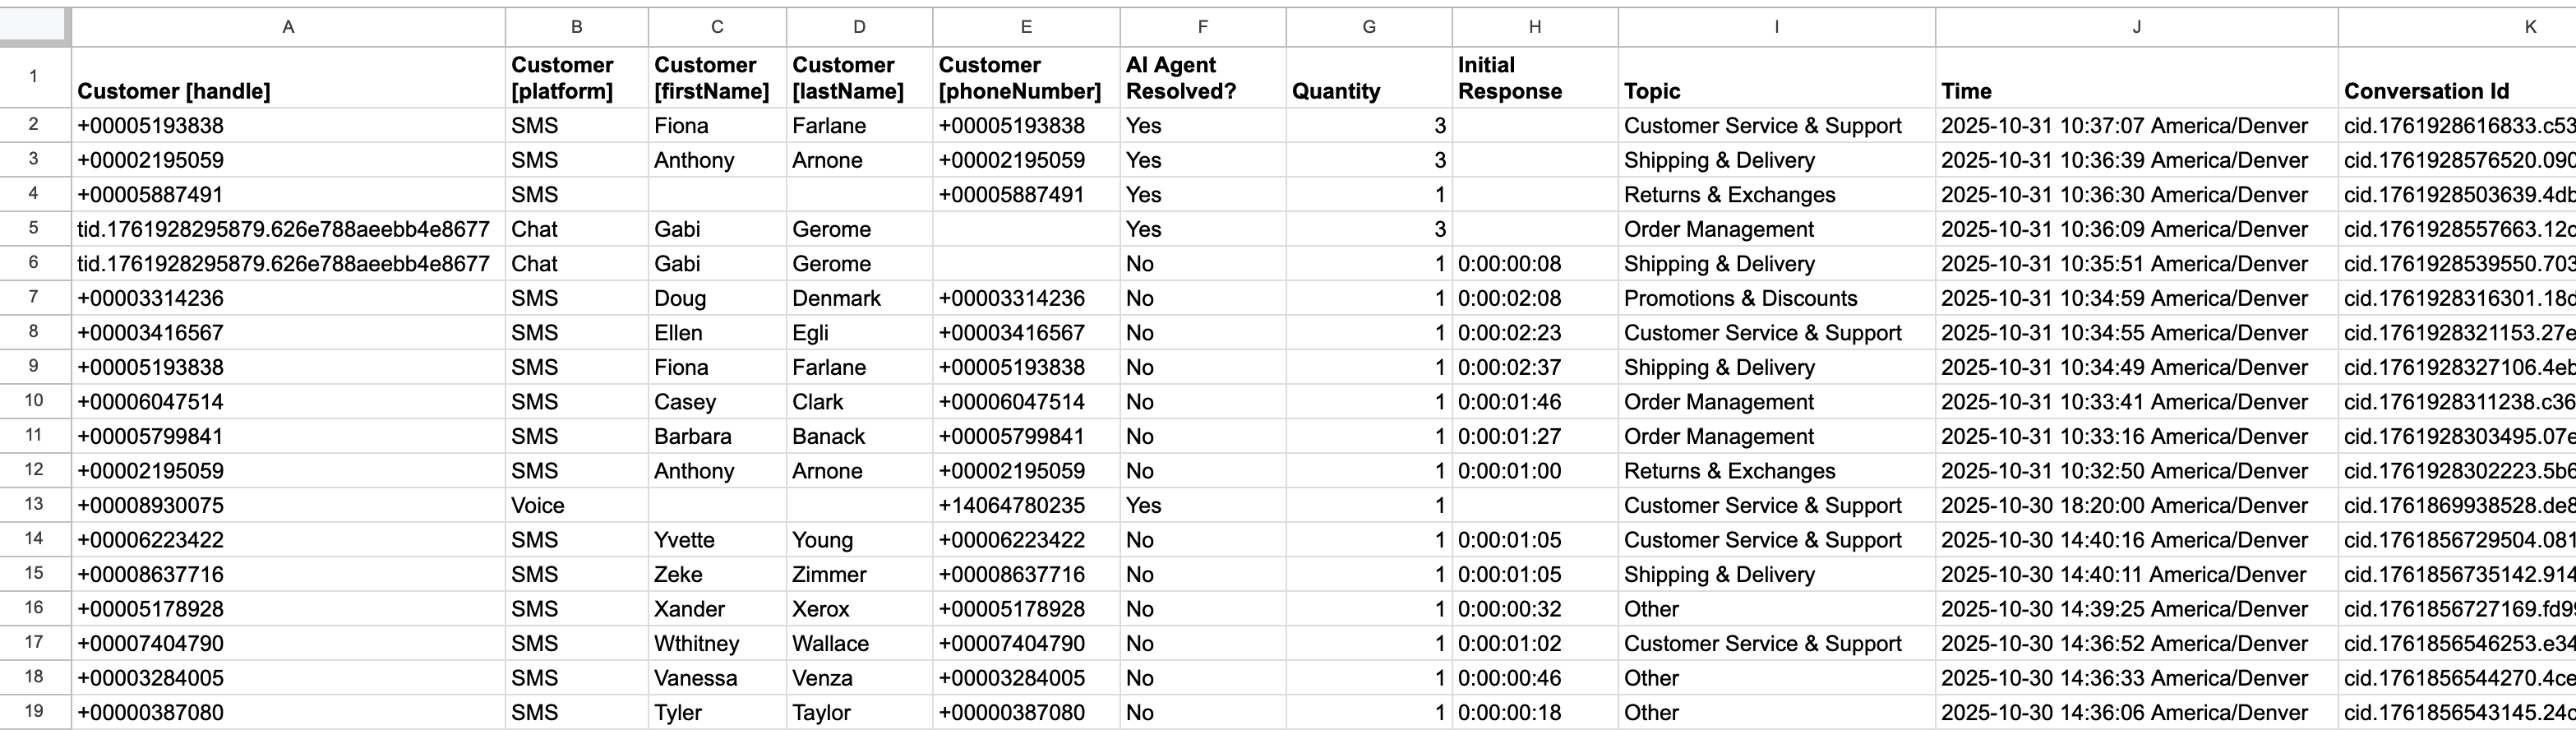
In the Event List view export, the Customer column will be broken out into columns for Handle, Platform, First Name and Last Name. The conversation ID is also included.
Extended Breakdown Data
The same as the above, but exports a full year of data broken out by calendar month and breakdown category, ending on the selected report end date. The current month will be month-to-date, and any breakdown category with no data in a given month will be omitted from the export.
Breakdowns Data Formatted
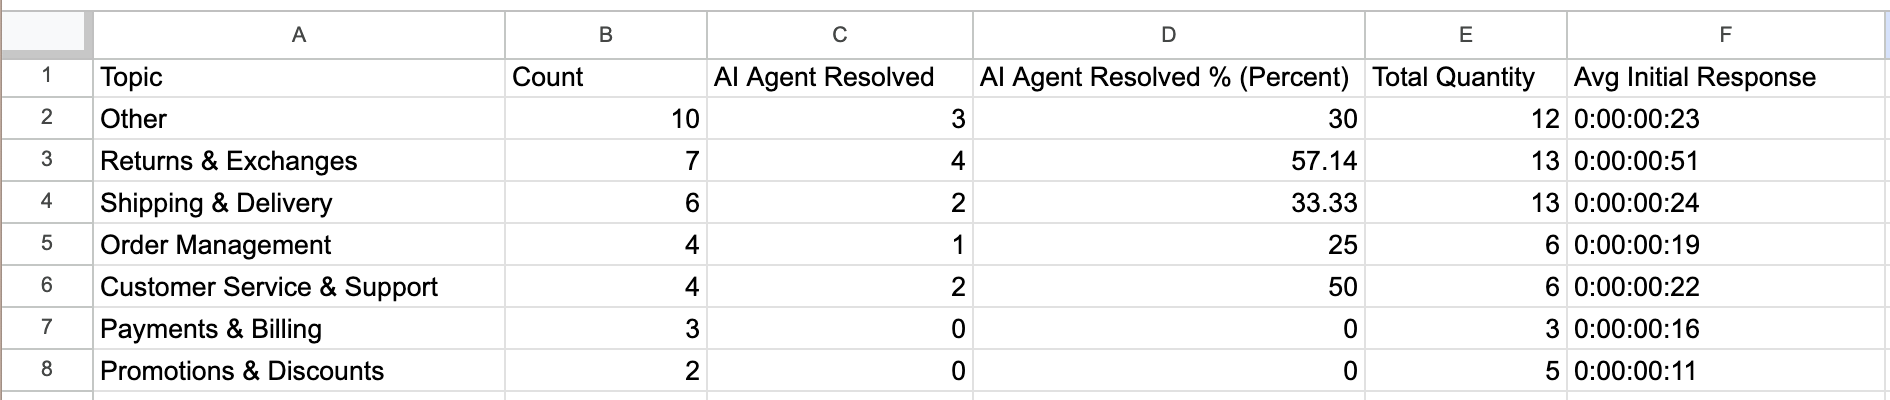
The formatted export option will provide the data for the metrics formatted as they appear when viewing the report in the Breakdowns UI. The formatted option also includes the fields and selected values for all selected breakdowns for the level that is exported, rather than only the breakdown of the current level.
In the Event List view export, the same columns are available, with the formatting applied.
Extended Breakdowns Data Formatted
The same as the above, but exports a full year of data broken out by calendar month and breakdown category, ending on the selected report end date. The current month will be month-to-date, and any breakdown category with no data in a given month will be omitted from the export.
Manager View for Breakdown Reports
Admin users can see all configured report add new reports and make changes to any report. Manager and Staff Admin users can open and view the reports to which they've been granted access, but their view is more limited.
When the Admin saves a Breakdown report after drilling into some level(s), the Manager user who opens the report cannot move up to a view data that they weren't given access to. Manager user can only drill down to more details breakdowns.
A Manager user cannot:
1. Save any changes. They may only Close the report and review to the list of reports to which they have access.
2. Change - or even see - any global filters criteria that was configured as part of the definition. They can add additional filters applicable just to their current session of the report.
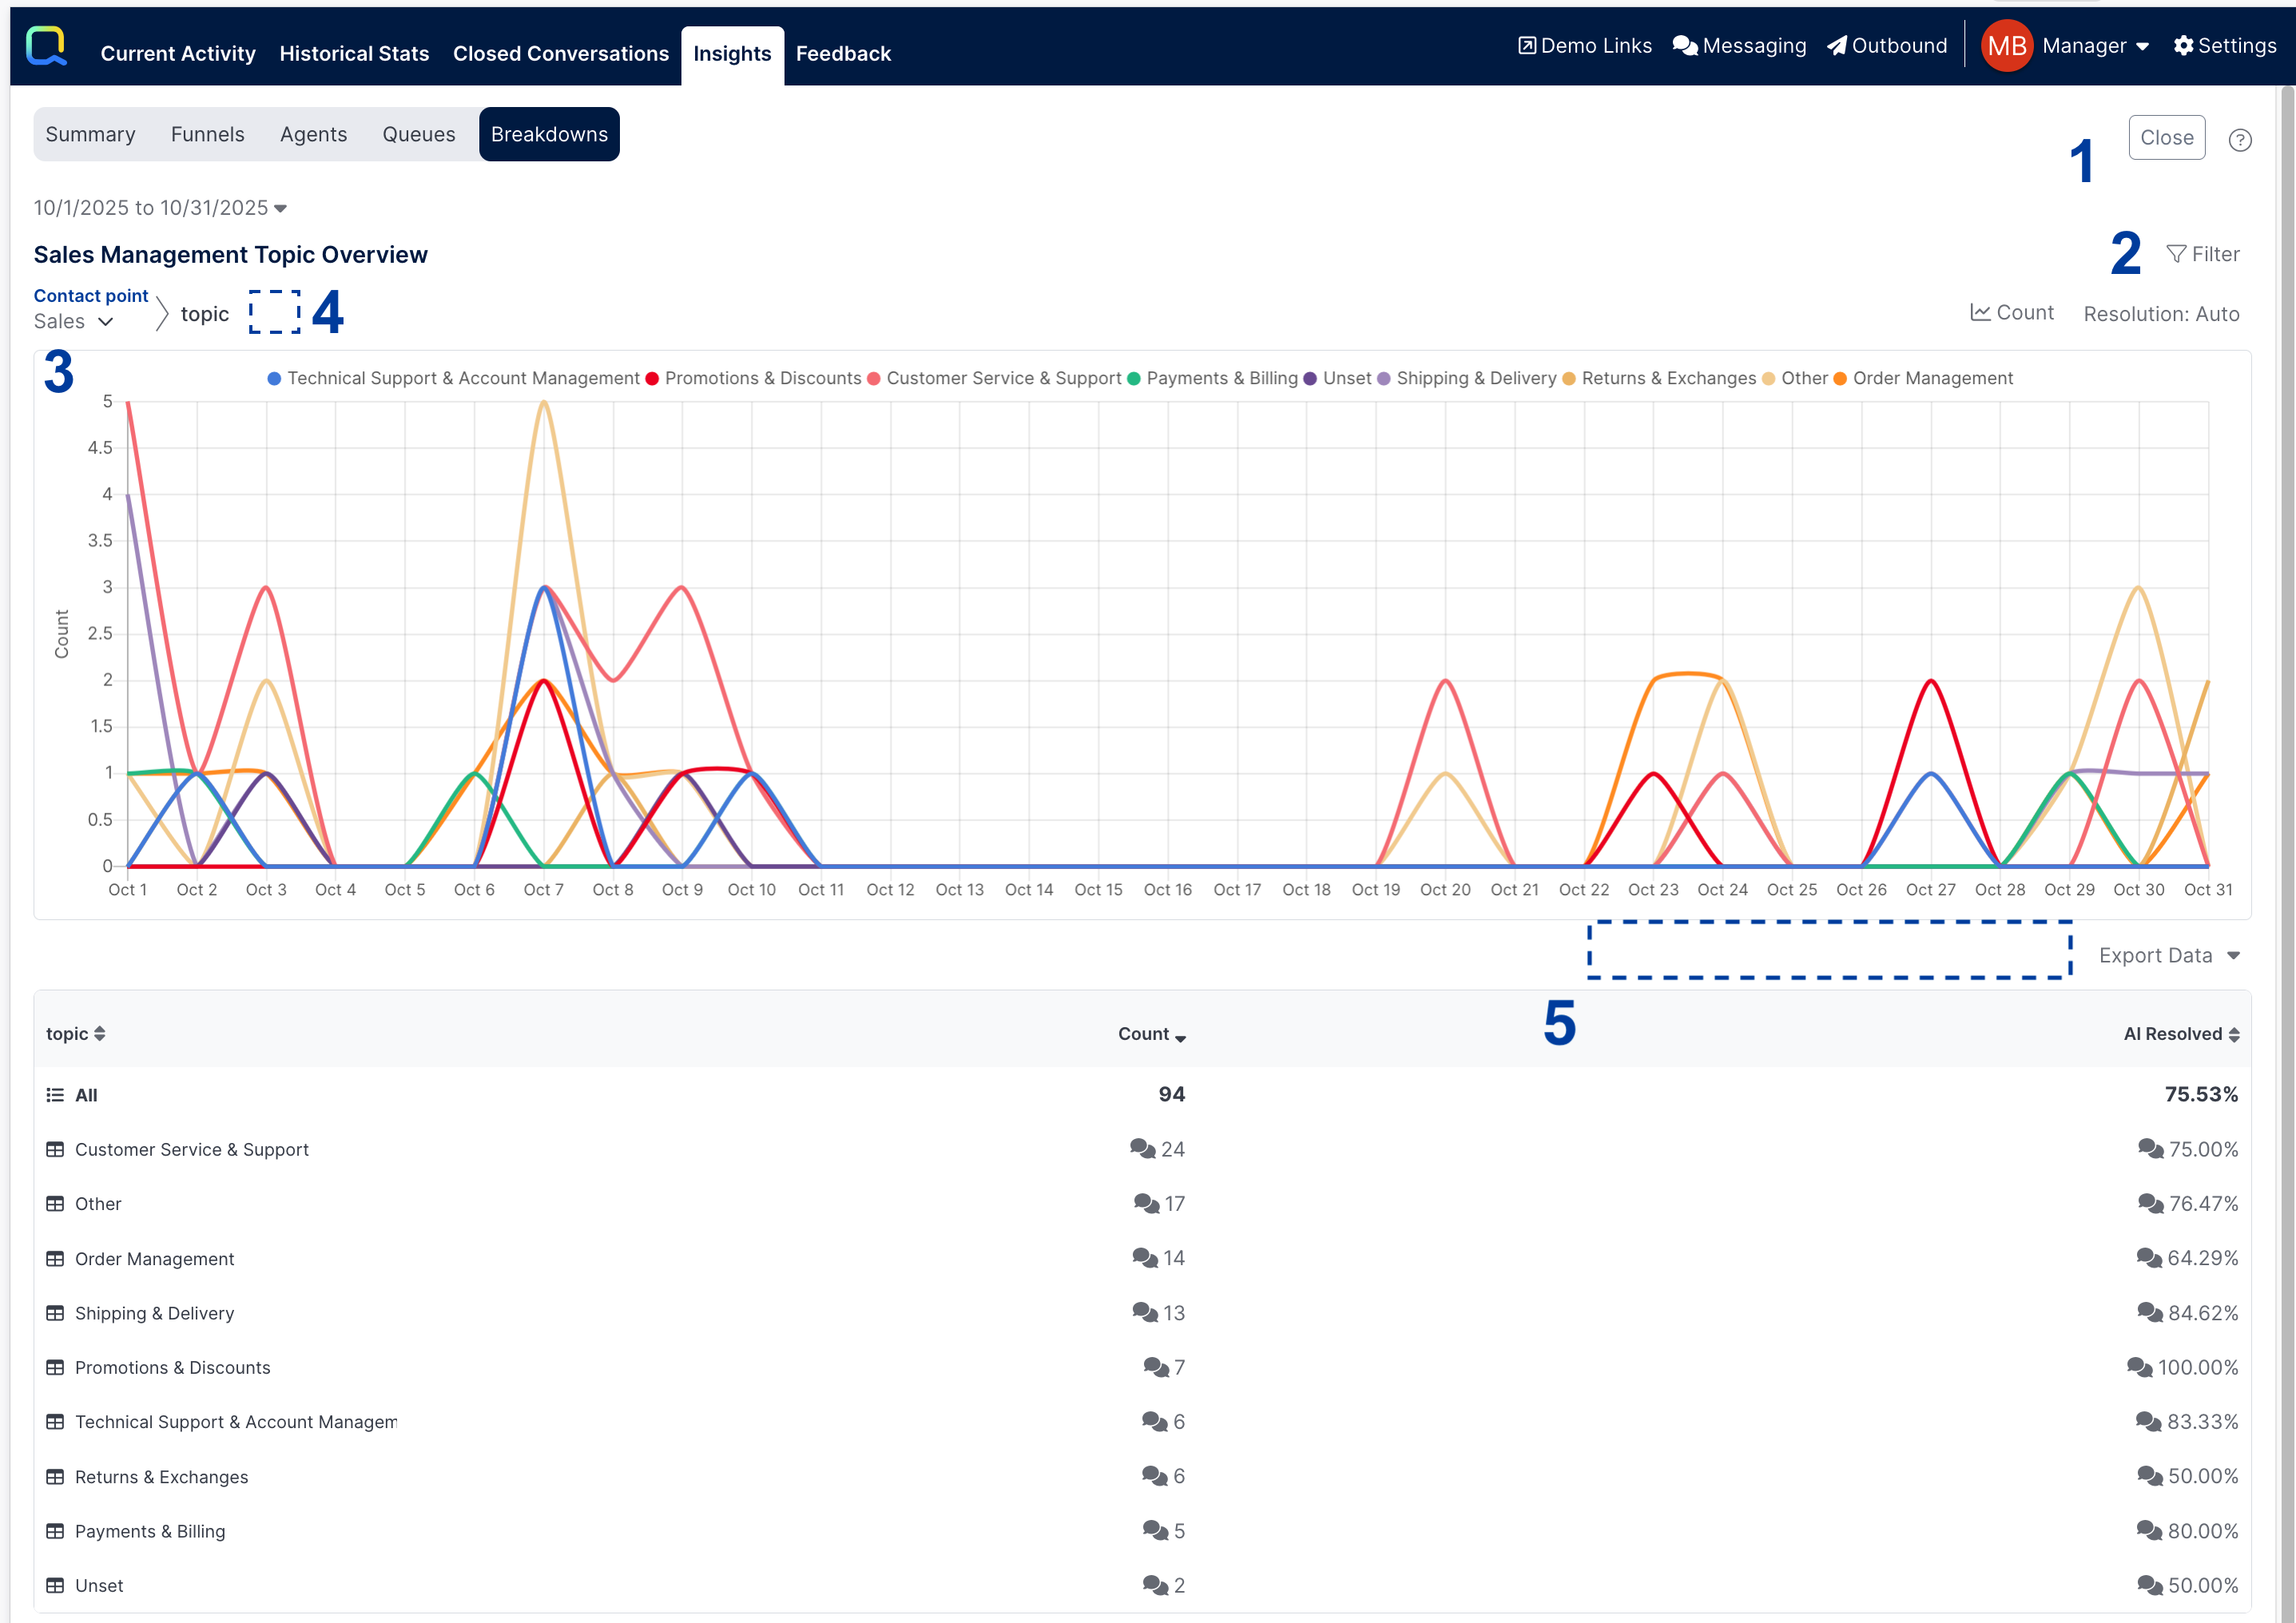
3. Move up to a broader level than that which they have been given access. Here the Admin saved the report after drilling into the Sales Contact Point. Managers granted access to this report cannot view the breakdown for other Contact Points. They are limited to only Sales data.
4. Configure existing or additional breakdown levels
5. Edit columns or change display options
A Manager user can:
1. Use the breadcrumb navigation to change the breakdown field value, and move back to previous levels that they can access.
2. View Events by drilling into theAll row and view individual conversation transcripts.
3. Drill into any breakdown row to open the next Breakdown level, or the Event List when at the last configured Breakdown level.
4. Export data to CSV.
5. Open a Conversation drilldown to view the conversations that were counted in the listed metric, and view the transcripts for each.
6. Change the metric that is displayed in the chart
Updated 3 months ago