
Reporting FAQs
Below you'll find answers to Frequently Asked Questions around Quiq's reporting and insights products.
Why are the numbers between my reports different?
It's common to have different visualizations or ways of measuring the same metrics within Quiq. For example, you may have a Funnel tracking how many customers go down a given path, a top level Summary Card, and a Breakdown Report, all measuring a similar metric. Below you'll find a list of things to check:
-
Customer vs. Conversation vs. Event counts: This is a common cause of numbers appearing different from one another. Ensuring that you understand exactly how your report is counting a given metric can help avoid confusion. We'll use the example of measuring "link clicks" to highlight how numbers can vary across Quiq. Below, we'll walk through a scenario where one customer clicked 5 links across 2 conversations within a specified date range:
- Customer journey types count each unique customer who performed an action. In this scenario, the count would be 1 (one unique customer click a link).
- Conversation journey types count each conversation where an action occurred. In this scenario, the count would be 2 (two conversations where a customer clicked a link).
- Event type reports: Some report types, like Breakdowns, and many columns in Agent Insights & Queue Insights, will count the number of events that occurred. In this scenario, a Breakdown report would show 5 (five link clicks).
-
Segments: Another common culprit is when one metric has a Segment applied to it and another doesn't. Ensure both reports you're looking at are using the same Segment:
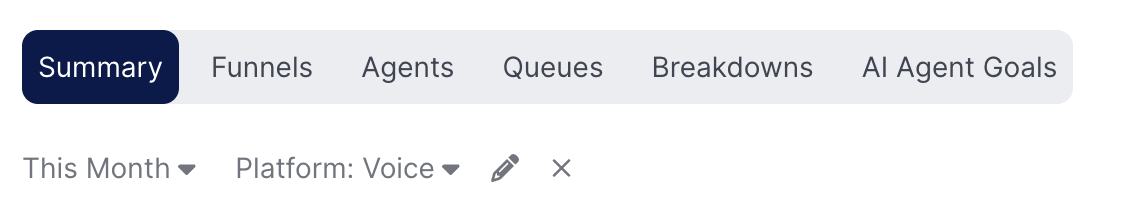
A Summary view with a Voice segment applied
-
Using different events: Oftentimes, there are multiple ways of measuring the same metric, for example, one report might record the metric based on when the conversation starts, another might measure when the conversation ends - this will lead to two different numbers, even if both analytics components look like they're measuring the same thing:
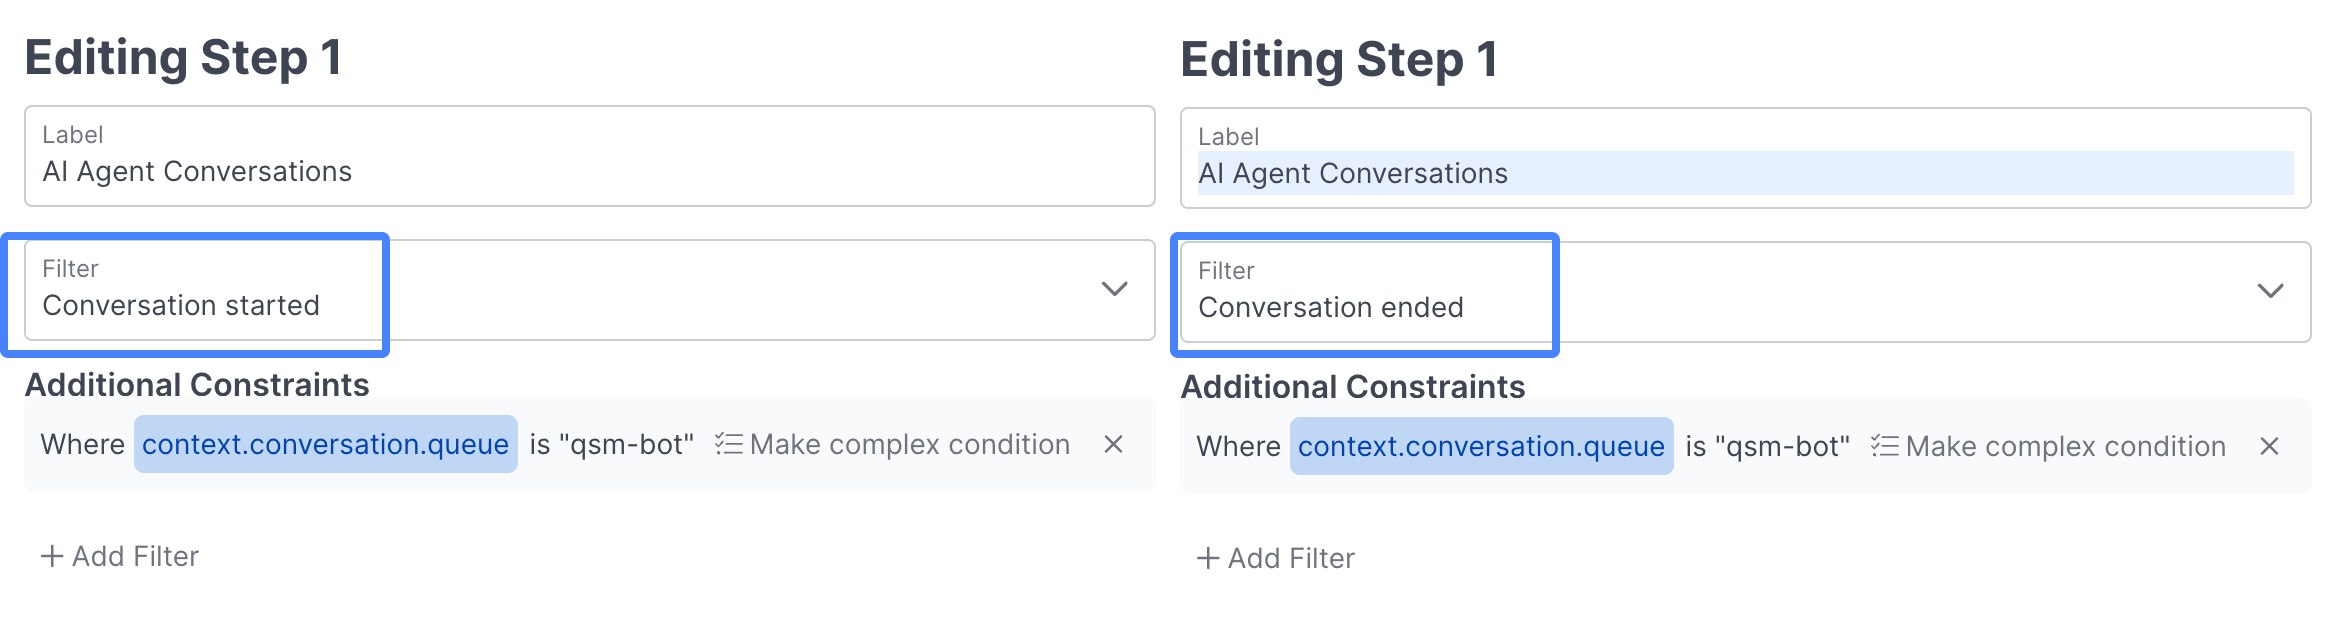
Two example Cards, both measuring AI Agent conversations, that are using different criteria for their metrics.
-
Multi-step funnels and cards: If your metric has multiple steps and you're comparing to a metric without multiple steps there are a couple things that can make those numbers appear different:
-
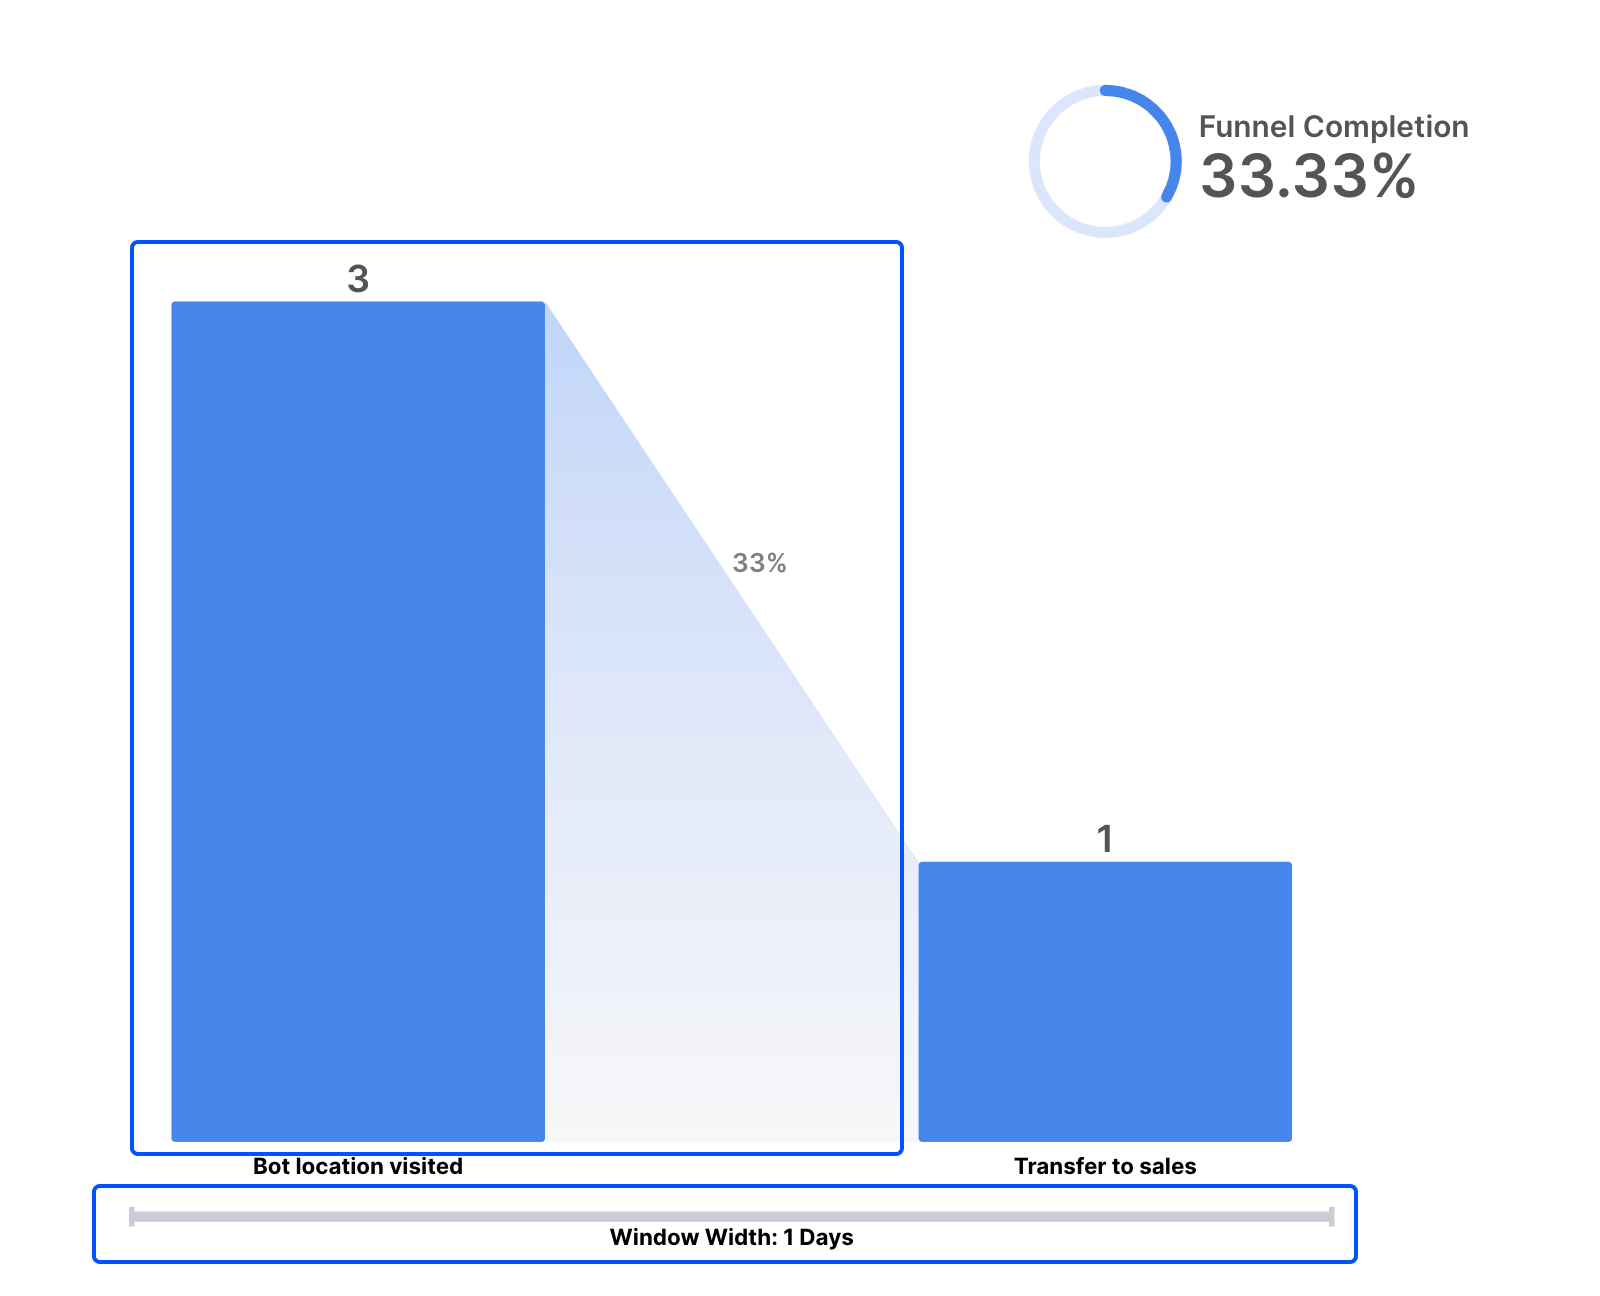
All steps in that Funnel or Card need to have been completed in order in a multi step funnel or card, in the example below the users need to visit the specific bot location referenced in order to count in the "transfer to sales" final step.
-
Users need to complete all steps within the specified window width, so even if you're looking at last 30 days, in this case the window width is set to 1 day, which means users have 1 day to get from step one to step two.
-
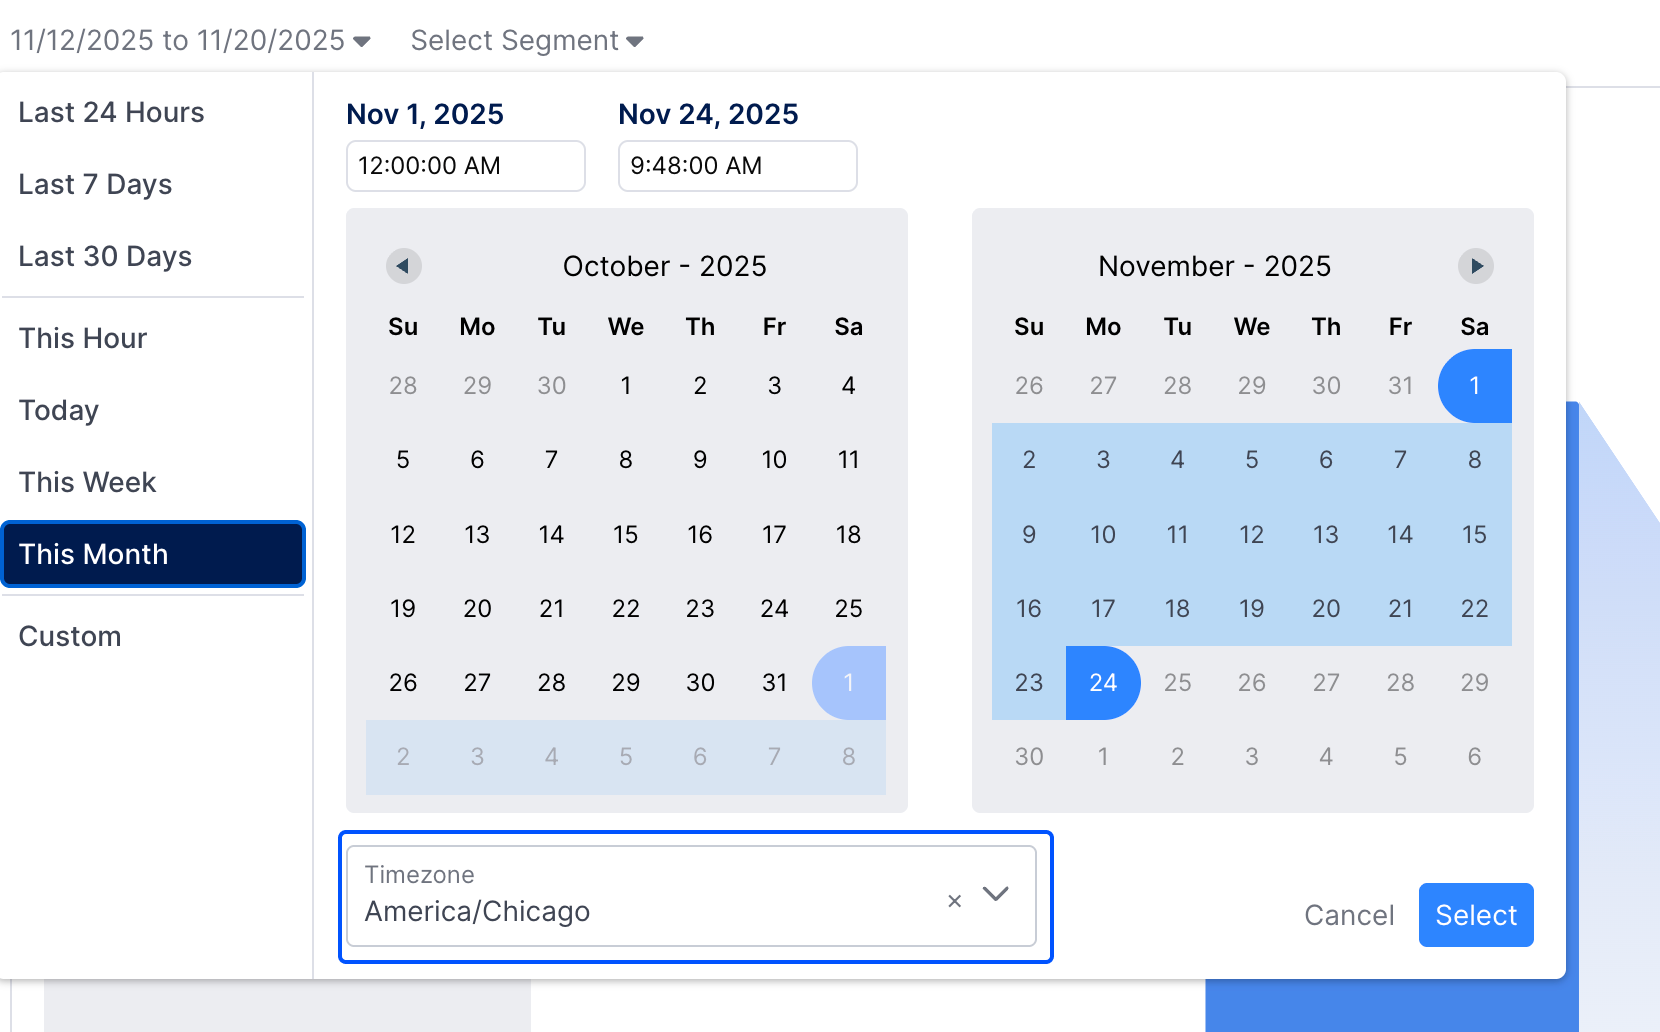
Date and Time Selector: When no timezone is selected, the selected time period will be in the user’s local timezone. If different people in different parts of the world are running the same report with seemingly the same input criteria, results could be different.
Compliance and Data Retention: Conversations removed via Compliance Tools or Data Retention Policies may still be counted in Insights metrics, but won't appear when drilling down into conversation details. This can make drilldowns appear to be "missing" conversations, but this is intentional: deleted conversation details cannot be displayed, though they remain counted in aggregate metrics.